Analytics Dashboard
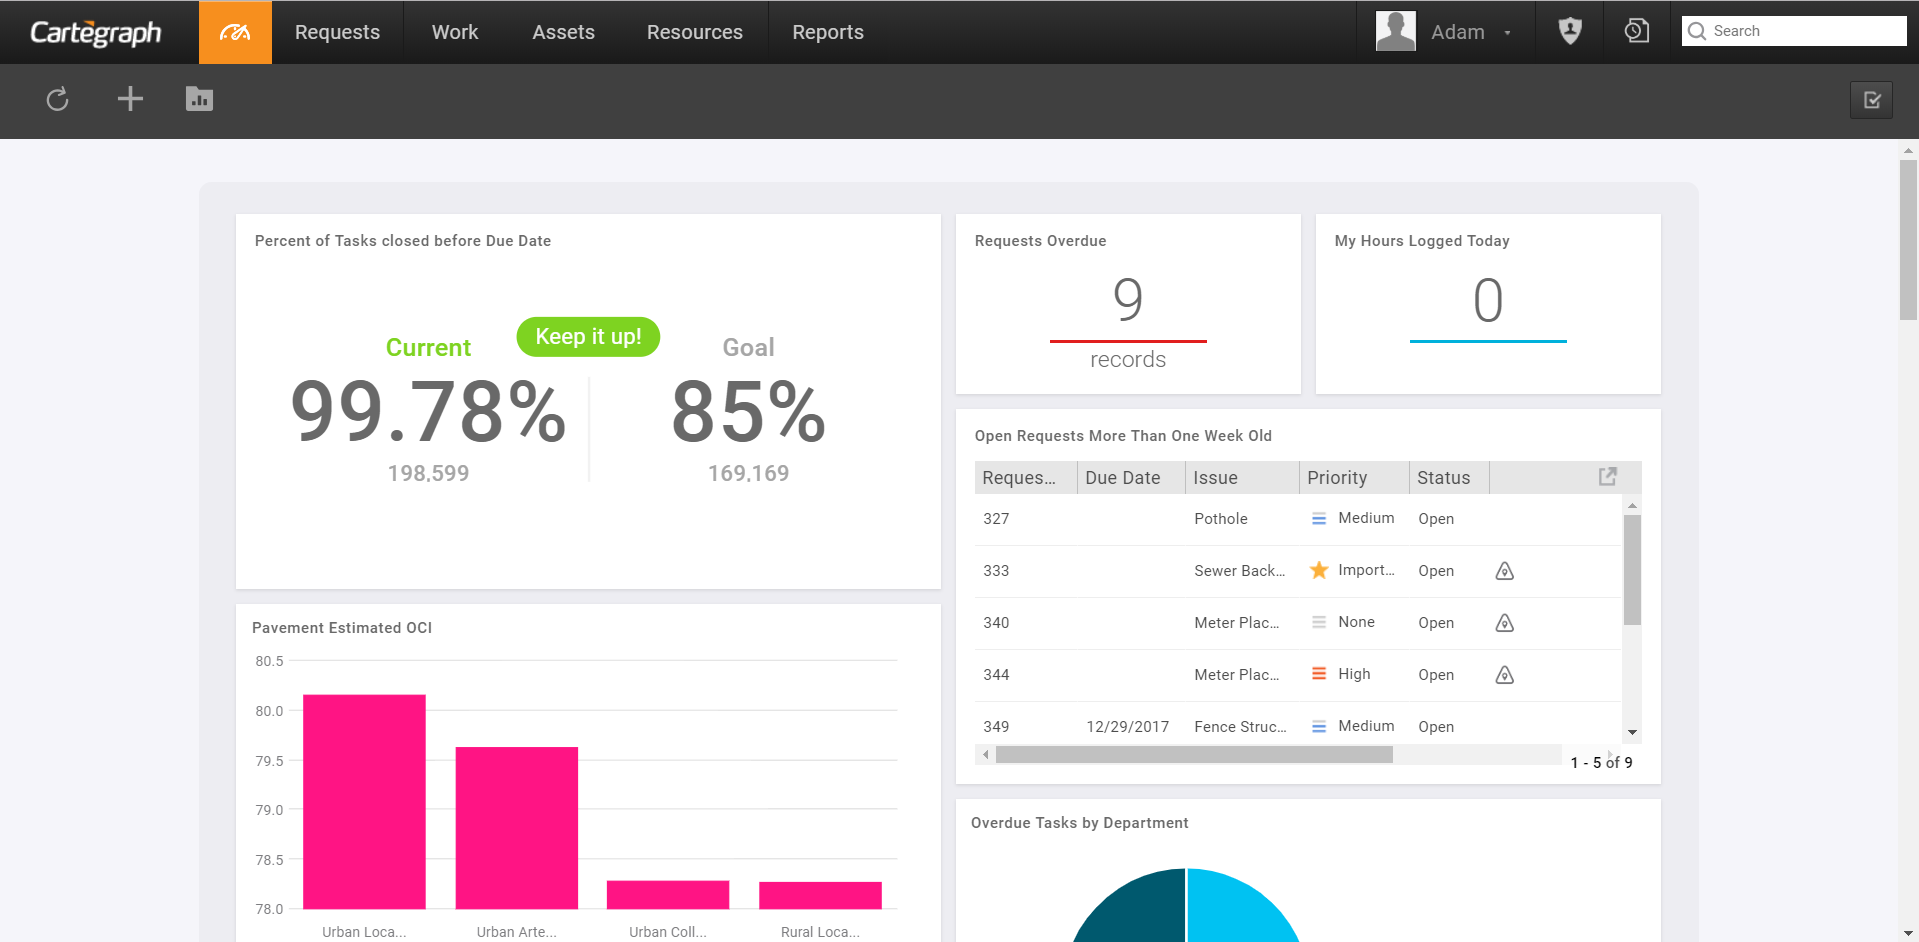
Cartegraph’s Analytics Dashboard takes the good data you capture and allows you to analyze that data and use it to guide your decisions by getting quick access to the data you care about—and make smarter decisions throughout your workday.
Rearrange, add, resize, and remove gadgets from the dashboard at any time. These changes immediately persist. Each time you sign into Cartegraph, the dashboard displays the same gadgets in the same layout.
When you need to view the data in more detail, select any grouping, like a bar, column, or slice, on the chart. A dialog box opens with a detailed list of the data in that group. This is where you change the grouping you want to view. The layout of this list is the same as the List view. Also available is a List gadget, which can be used to quickly show records on your dashboard without going to a list view.
Each gadget has an action menu that allows you to:
- Edit the gadget data.
- Duplicate the gadget data to customize a Library gadget.
- Export as a PDF, PNG, or CSV to share and analyze the data as a document, image, or spreadsheet. List gadgets are CSV export only.
- Resize the gadget with the Size menu option. Only the applicable sizes are shown in the menu. This menu option only displays if the size can be changed.
- Delete to permanently remove the gadget from your dashboard.
The maximum number of gadgets allowed in the dashboard is 20. The maximum number of bars in a column/bar chart is 20. Data is truncated but still visible in the Drill Down dialog box by clicking on a bar in the chart. If multiple Group By fields are selected, the maximum number of bars is 64 (or 108 if you are doing a time series grouping). Data will be arranged so each cluster of bars has the same exact subset of categories. For example, if you are grouping by a Date Field and a Lookup, the Lookup values will be truncated to accommodate for 64 bars.
Each gadget is made of:
- gadget types
- a title
- a recordset
- a filter
- a list of roles and users to share with Gadgets created by you are automatically available in your Gadget Library. The selected roles and users will also have access to this gadget in their Gadget Library.
Bar, column, and pie gadgets also have Group by fields. This is limited to Lookup, Text, Yes/No, Date, Date/Time, and Time field types.
If the recordset chosen is a child level recordset, then the group by options will also include the parent level recordset fields.
For Date, Date/Time, and Time fields, you will also need to choose how the grouping should be performed:
- Hour of day
- Day of week
- Week of year
- Month
- Quarter
- Year
- Month and year
- Quarter and year
- A second Group By field
- Available for bar and column charts.
- List is limited to Lookup, Text, and Yes/No fields. Date fields are not available in the second Group By.
- Using this will create clusters of bar/columns to help visualize your data.
- Measured-by parameter
- Total Count is the default.
- If you select a different field, the Sum or Average option of the selected field overall records in each group displays.
- This list is limited to Integer, Floating Point, Currency, and Quantity field types.
- For Quantity fields, you also need to select the Unit to Convert all of the data before summing or averaging.
Preview
A Gadget Preview is available when you create or edit gadgets to see a preview of the gadget before it is saved to the dashboard and/or gadget library.
A preview is only available when the minimum required of fields are selected in the create process. Once a preview can be generated, a Preview button displays. Click Preview to see what the gadget will look like in the dashboard. If any of the setup fields are changed, the Preview button displays again to see the updated version of the gadget. List gadgets automatically generate a preview once a recordset is selected.
The gadget previewer is available when creating editing, or duplicating a gadget.
You can have additional gadgets stored in the Gadget Library. The library includes those on your dashboard and those shared by other users.
Legends
Gadget legends show the data point attached to each color and serve as an interactive way to filter the data displayed. Select and clear the legend values to show only the selected values in the legend. The legend works this way for bar, column, and pie charts.
The legend displays on bar and column charts if more than one group by field is selected and if the charts are grouped by a single date field with month over year or quarter over year.
Multiple Groupings
Use more than one grouping to create a Clustered Bar or Clustered Column chart gadget. These clustered bars of data work as two charts in one. Here are some key things to know about multiple groupings:
- They are not available for List gadgets.
- The number of bars per group is limited to 8, and the total number of bars allowed is 64. If you are doing a time series grouping (month and year or quarter and year), then the total number allowed is 108.
- The first Group By field can be any field except:
- Attachment
- Number
- Currency
- The second Group By field cannot be a Date, Date/Time, or Time field. Dates are only available in the first Group By field.
- Advanced Filters should be used whenever possible to make sure the data is legible and informative. Too many records can clutter up your chart and provide no additional value.
- When grouping by a Date, Date/Time, or Time field, select to group by Quarter and Year as well as Month and Year. Grouping in one of these ways also shows a Clustered Bar or Clustered Column chart. Each bar or column represents the data for a single quarter or month in a given year.
Gadget Drill Down
When you need to view the data in more detail, select any grouping, like a bar, column, or slice, on the chart, and a dialog box opens with a detailed list of the data in that group. The list shows all of the records that belong to that particular group. You can change the selected grouping using the fields near the top of the dialog. There is a field for each group by field. This allows you to navigate through the data without closing the dialog box and selecting a different bar, column, or slice on the chart. The upper right-hand corner of the dialog box shows the aggregate value for the group(s) selected. Each field has an All option that is always the first item in the field. This shows all records from that particular grouping.
The list columns and arrangement are based on your persisted list view settings, depending on the recordset you are viewing. Any changes made in the drill down view or list view display here.
Refresh Gadget
There are two methods to refresh your gadget:
- Refresh your full page by refreshing your browser.
- Refresh all gadgets by clicking.
Navigation Persistence
Cartegraph uses in-session persistence to remember the view display as you navigate around the system, so when you return to a view it is the same as when you left it, as long as you are signed in. If you sign out and sign in the persistence from the previous session goes away. For example, on the Sign Asset Detail view and navigate to the Resources tab, when you click on the Assets tab you are brought back to the same Sign Detail view you navigated away from.
Double-click on the view’s tab to clear the persistence and return to the default display.
Cross-session persistence is when your display persists when you sign out and sign back in to Cartegraph. For example:
- Analytics dashboard arrangement
- added layers in layer panel
- unsaved changes to layers in layer panel
- favorite layers
- list view column selections
- time sheet display
- map view zoom and location
- map filter button
- Detail view selected records
- Sign In dialog box remembers your name
- selected tab (Requests, Work, etc.)
NOTE: Persistence does not apply to Resource Entry or the collapsed state of the map warning, Some records are not displayed on the map.”
NOTE: When the Asset List view has more than one Asset type the sort order, column order, and column widths persist where ever that Asset list displays in the system:
- Asset List view
- Components Detail view
- Editing Asset Connections dialog box
- Non-Location Asset Connections dialog box
If you make a change in one of these areas, the change persists to all the others.
There are two exceptions:
- If you make a change while in the Editing Asset Connection dialog box, when you return to the Components tab, your change is not immediately reflected. Do a browser refresh or go to the Asset List view and return to the Components screen, and the change displays.
- If you make a change while in the Non-Location Asset Connection dialog box, when you return to the Editing Asset Connections dialog box, your change is not immediately reflected. Also, when you close the Editing Asset Connections dialog box to return to the Components tab, it is not reflected either. Once you do a browser refresh or go to the Asset List view and return to the Components tab, the change displays. You cannot do a browser refresh when in the Editing Asset Connections dialog box because you are in edit mode. A refresh takes you out of the dialog box.
Global Search
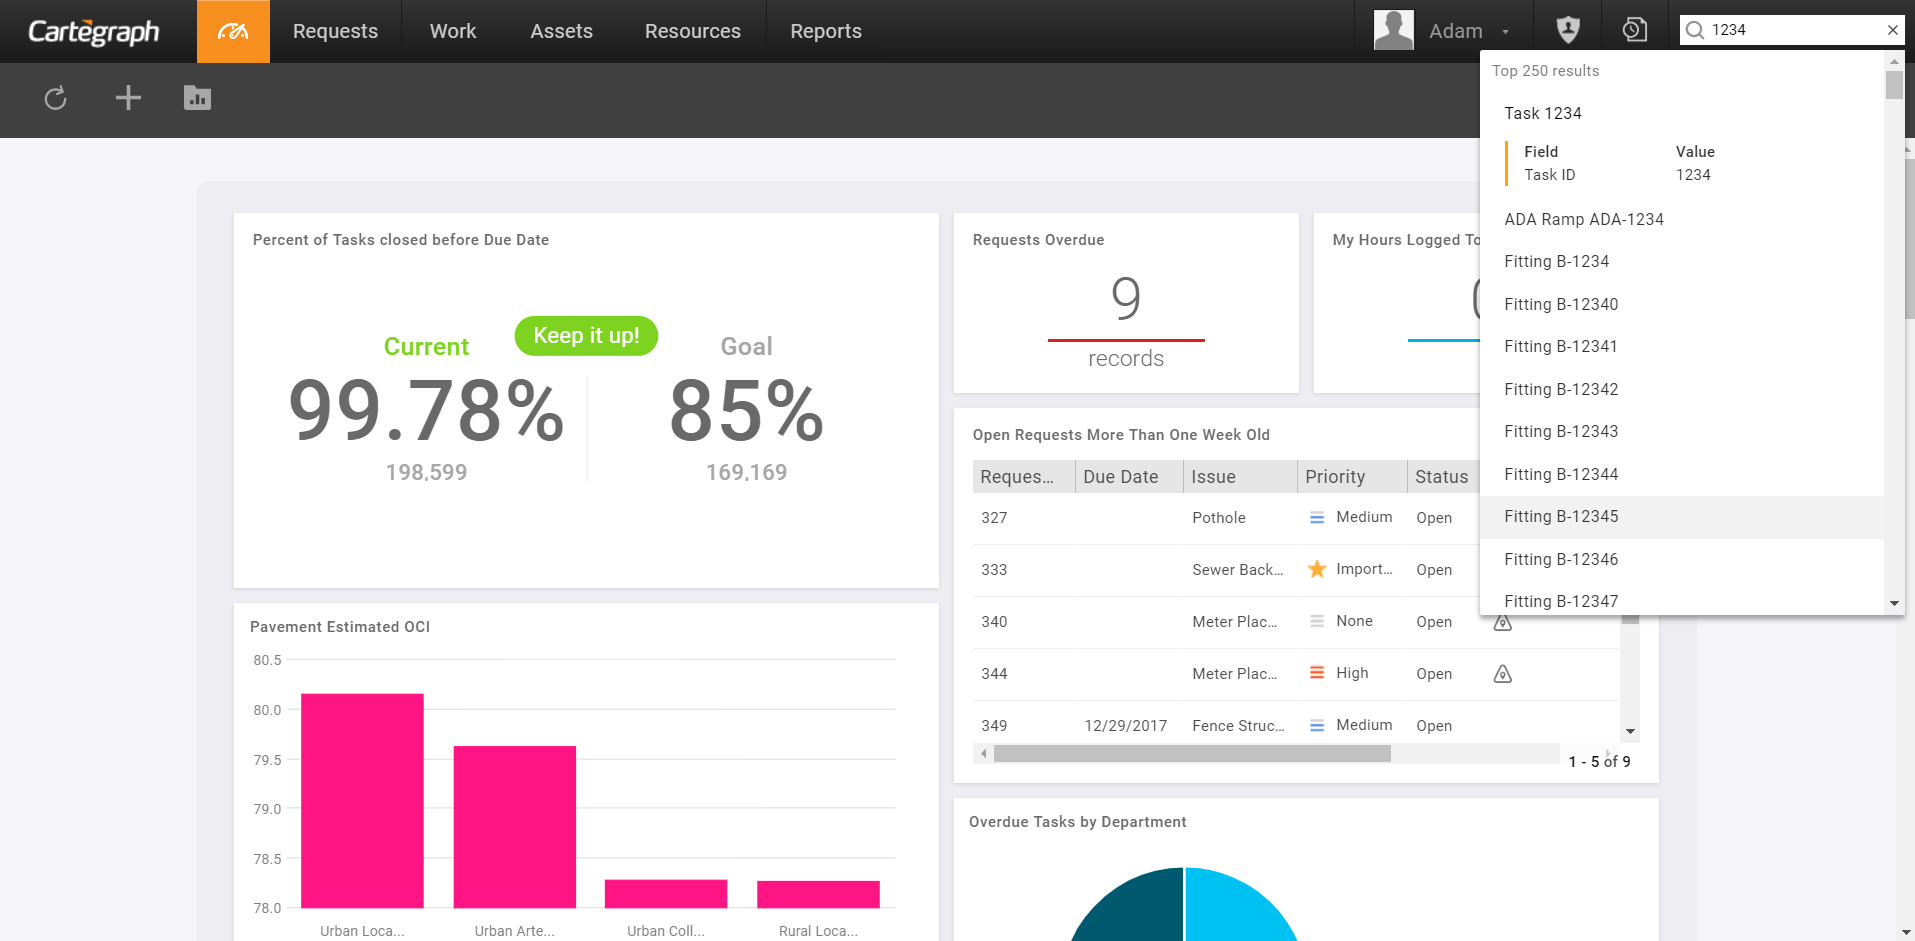
Search for records across the entire Cartegraph system. The Search field is available in any view of Cartegraph. The following are searched:
- Requests
- Work Orders
- Tasks
- All Assets
- Resources
- Labor
- Equipment
- Material
- Material Location
- Vendors
Search Parameters
- Search is performed on the ID as well as any text fields. ID is searched for using contains instead of an exact match. Before the search is performed, the search terms are analyzed to see if they contain a recordset’s singular name. If this occurs:
- In order for there to be a match, words in the singular name must contain in the search terms exactly as they do in Structure Manager.
- The first occurrence of each word from the singular name is excluded from the terms that are searched in that recordset.
- Search results are ordered by the most specific matches on singular name appear.
- The following fields are not used for searching:
- Entered By
- Last Modified By
- Usage Unit
- Any lookup fields to the following
- Any top level recordset (Assets, Work Orders, Task, Requests, Resources)
- Inspections
- Attachments
- Enter search text and press the Enter key.
- Select X from the Search field to clear the search text and cancel any searches in progress.
- While a search is in progress pressing the Esc key to cancel the search.
- To see the list of fields and their values where the search terms were found, hover over the row and click Details. Click Details again to collapse.
- If more than 250 records matched the search criteria, only the top 250 are returned.
Certain words are excluded from the search, such as a, and, is, and the, to name a few, since they clutter the search results.
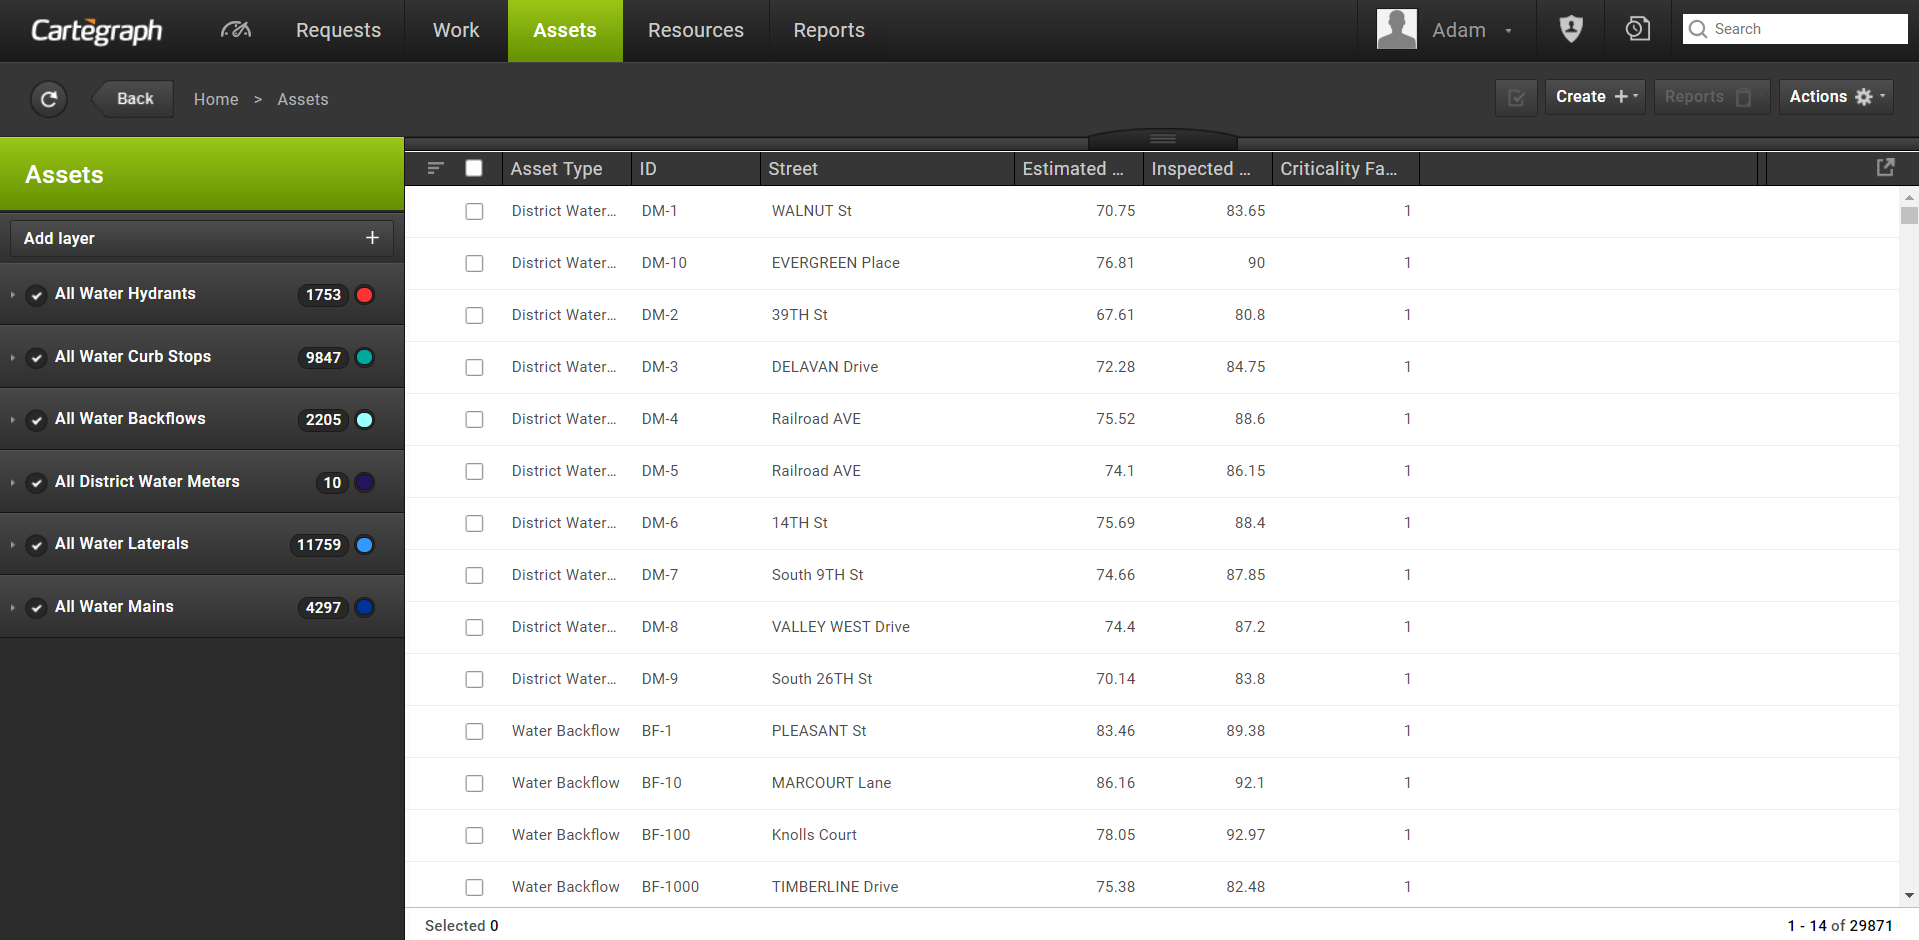
Table of Contents/ Layers
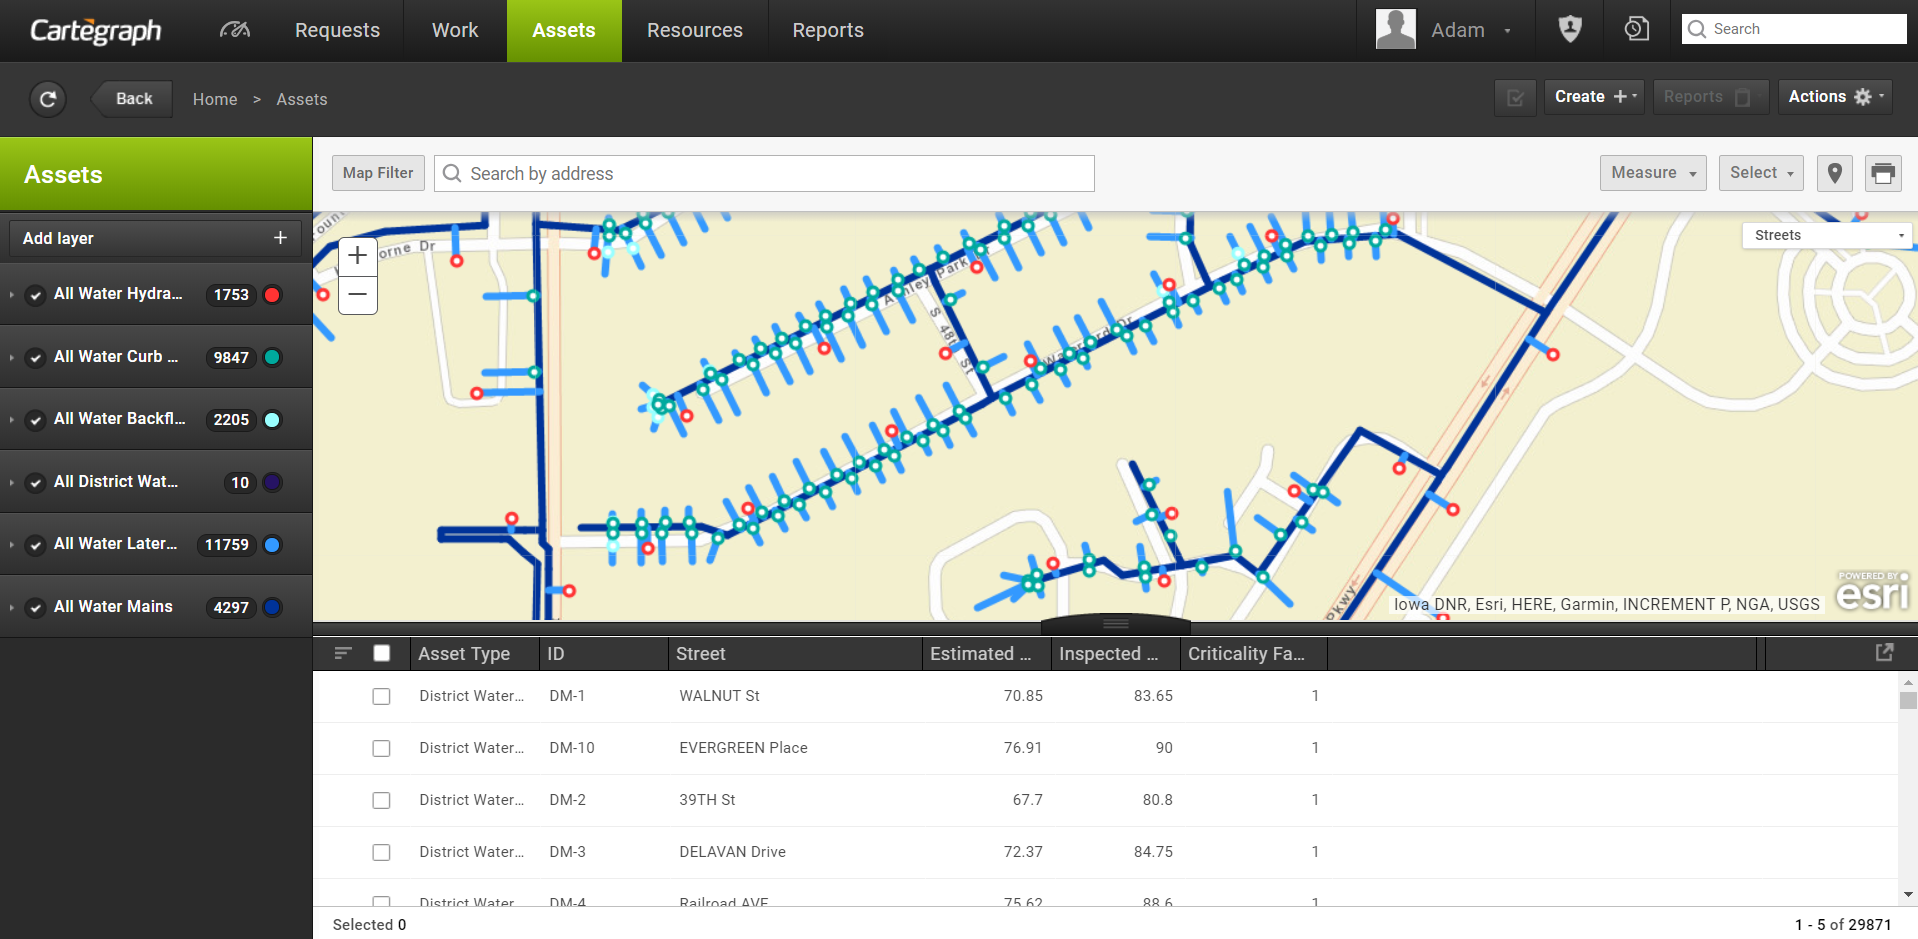
Layers, displayed on the left-hand side of the above image, are used to filter the data you view throughout the system.
Add Layers
- Click the Add Layer button to open a list of layers to select. The list includes all Cartegraph default layers as well as any saved layers available to the user.
- Use Search to limit the list of available layers. Use multiple search terms, separated by spaces. Search by layer name, owner name, and/or recordset (asset only). Click the X to clear the search terms.
- After adding a layer to the layer panel, it can be edited. This does not change the original layer, only the copy in the Layer panel.
- Remove a layer removes the layer from view in the Layer panel. If the layer is saved or a Cartegraph Default layer, it is always available from the Add Layer menu.
Favorite Layers
- Layers can be marked as a favorite by clicking the Mark as Favorite star, on the layer.
- Layers marked as favorites are at the top of the list the next time the list of layers is opened.
- Click the favorited layer’s star button again to remove it as a favorite.
- The favorites are stored as part of user persistence and are removed if user persistence is cleared.
Save Layers
- Any changes made to layers in the Layer panel persist. Updates to the layer stay until the layer is removed or user persistence is cleared.
- All users have the ability to save layers from the Layer panel to keep their changes. Saved layers are available from the Add Layer menu and stay even when user persistence is cleared.
- The name of a saved layer must be unique for each Recordset for each user. For example, each user may only have one saved Task layer named My Tasks.
- When saving a layer, the user is prompted to either enter a new name or overwrite the existing layer if there is a conflict with the entered name.
Share Layers
- Users with Share Layers permission can share their saved layers to roles or specific users.
- If the user has Share Layers permission, clicking Save Layer opens the Save Layer dialog box to edit the users and roles that share the layer.
- Shared Layers that a user has saved and Shared Layers that have been shared with the user or with the user’s role are available from the Add Layer menu.
- To update or manage the shares of an existing layer, click Save Layer. The updated layer is available on the Add Layer menu. Any copies of the layer that exist in users’ Layer Panel are not updated to avoid overwriting the individual changes made in the Layer panel.
- The permissions for Share Layers are available in Role Administration.
Delete Layers
- Layers are deleted by clicking the delete button in the Add Layer menu.
- When a layer is deleted, it is removed from the Add Layer menu. It is not removed from the Layer Panel of users who have selected the layer.
- Users can only delete layers they created.
- Administrators can delete any layers, except Cartegraph Default layers, by accessing Manage Layers.
Map Tools
Map View
The Map view displays the location of Assets, Requests, Tasks, and Work Orders with associated Tasks, if the record has a location specified. This allows you to visually track every part of your day-to-day operations.
- The Map view uses Esri maps and their different view types. For example, imagery and street.
- The Map view and List view work together to display the records in the List view with locations.
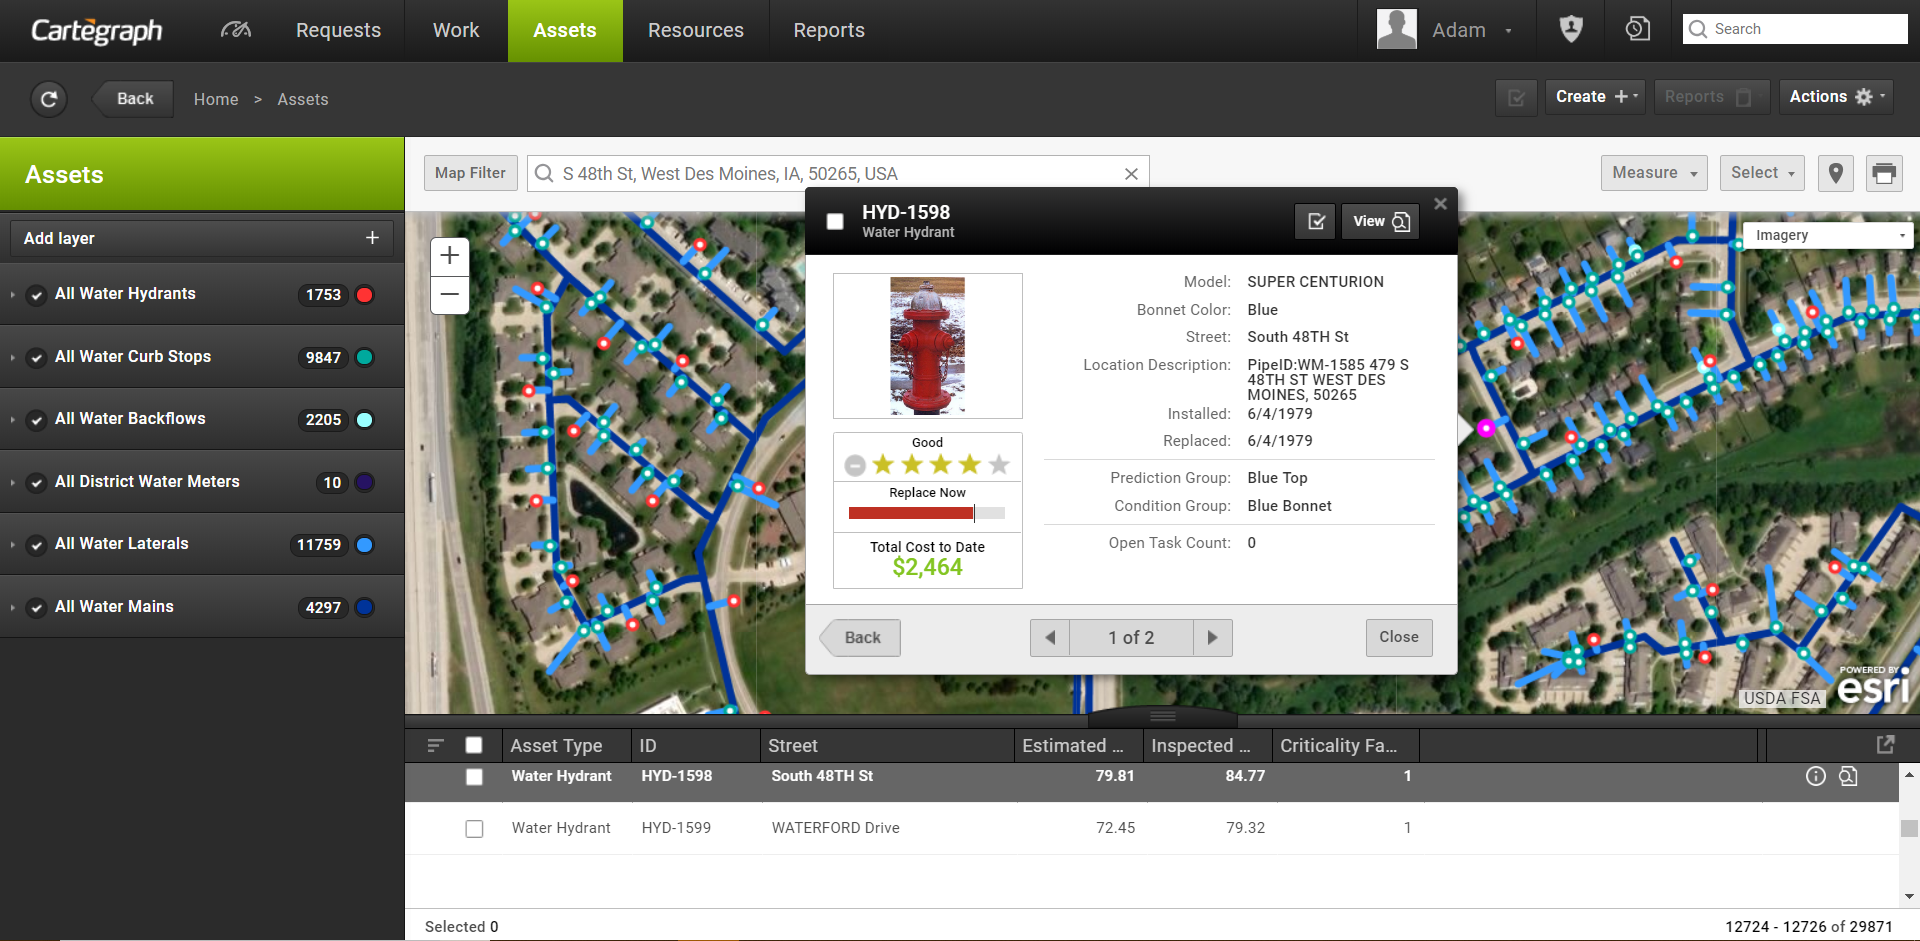
- If more than one map symbol is at the location you click, the Multiple Record mini-map tip displays, allowing you to scroll through each record at that location.
- Click any map symbol to view a Mini-Map tip identifying the record.
- In the Mini-Map tip, click View to go to the Detail view of the selected record.
- In the Mini-Map tip, click to view a summary of the record in the Summary tip.
- Work Order Summary tips display the Work Order Details and Work Order Task information.
- Task Summary tips display the Task detail and Asset detail if the Task is associated to an asset.
- Asset Summary tips display some Asset detail.
- When too many records are in one area of the map, displays in the map view. with a message that not all records are displayed in the map. Zoom in or add a filter to decrease the number of records to display.
- The currently selected record displays on the map in magenta.
- When Map view is zoomed into specific records click Map Filter to display the records in List view. When Map filter is cleared the List view displays the previous records.
- In the Address Search field, enter an address or longitude/latitude coordinates. A suggestion list opens as you type. Press the Enter key to move the map pin to the location specified in the search field or select the desired suggestion in the list to move the map pin to that location.
If anything is highlighted in the suggestion list, press the ENTER key to use the highlighted selection in the suggestion list.
- Click X in the search field to close the suggestion list and clear the search field. Examples of supported longitude/latitude coordinates for the World Geocode service, which is the default geolocation service. Leading zeroes are optional:
- 641988 N42.491288
- 641988, N42.491288
- -090.641988 042.491288
- -90.641988, 42.491288
- This is an example of supported longitude/latitude coordinates for an alternative Esri locator, -90.641988, 42.491288
- Click Current Location to center the map to your location.
- Click Print Map to print the map currently displayed.
- Use the Selection Tool to draw a polygon around map symbols to select a group of records. The shape must be a polygon, and the lines of the polygon cannot cross. The records selected in the map display as selected in the List view. Click one of the map symbols to scroll to that record in the list.
- To clear the selection, clear all selections in the List view or clear and reselect the layer in the Layer panel.
If you have an ArcGIS Named User License, these features are also available:
- Click Select to select items in the map using one of the available tools:
- Draw polygon
- Radial Distance
- Linear Offset
- Polygon Offset
- Spatial Analysis—Only available in Asset List map
- Click Measure to measure the area of a polygon, the length of a line, or find the coordinates of a point.
Cartegraph Basemaps
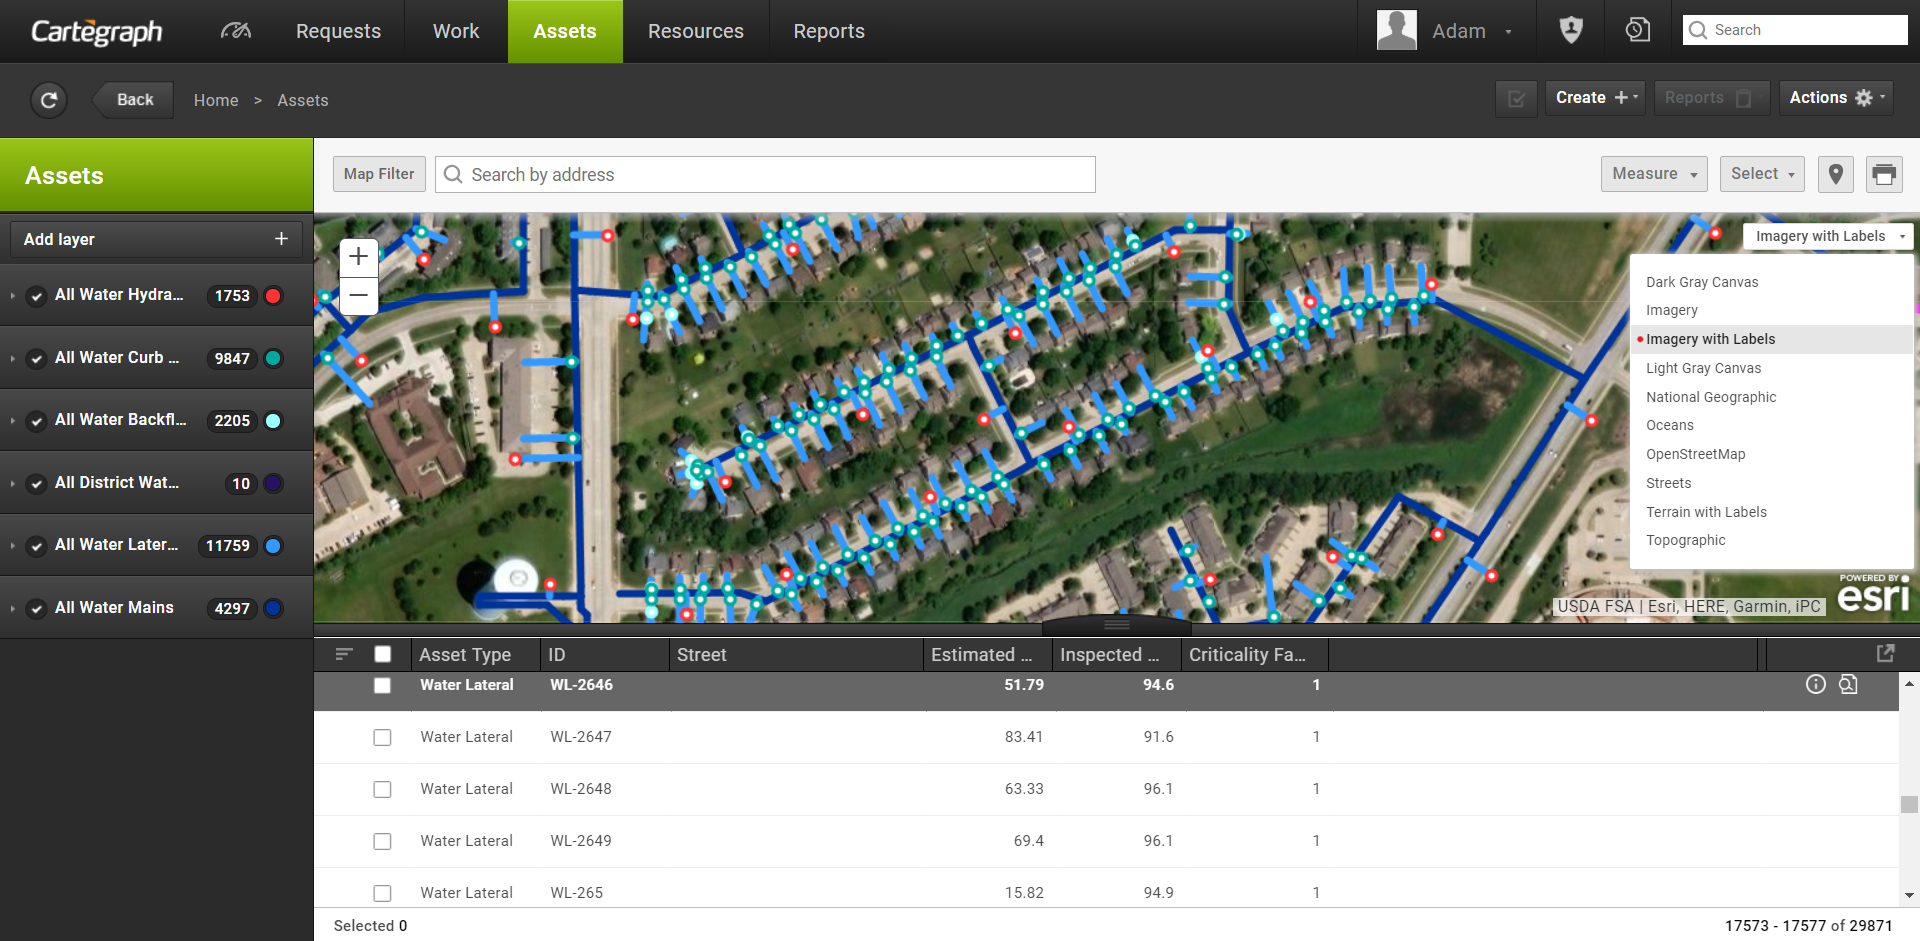
The Cartegraph Map view contains basemaps configured in ArcGIS Online or Portal, based on the Esri permissions of the signed in Cartegraph user. These include web maps:
- Shared to the organization’s Basemap Gallery
- Shared to the Organization
- Shared to any Groups the Cartegraph user belongs to
- Owned by the Cartegraph user
To limit the Esri web maps that display in Cartegraph, have the Esri Administrator create a Group, share only the desired Esri web maps with this group, and then set the Basemap Gallery to use this group. All users part of the organization sees at least these maps in Cartegraph. See the Basemap Gallery setup in ArcGIS Online or Portal topic for more information.
In addition to the Basemap Gallery maps and web maps created by the user, web maps created by individuals in the organization that are shared to the organization or to specific groups also display in the Cartegraph map view, based on the user.
To further limit the web maps that display in the Cartegraph map view, have the Cartegraph Administrator edit the ArcGISWebMapTag system setting. Only web maps that contain that tag are displayed, based on the above criteria. Web map tags are configured in ArcGIS Online or Portal.
Esri web maps that are shared as Public in ArcGIS Online or as Everyone in Portal for ArcGIS Online are not available in Cartegraph.
If no maps are configured in ArcGIS Online or Portal, the Esri Streets map displays in the Cartegraph Map view.
Map Selection Tools
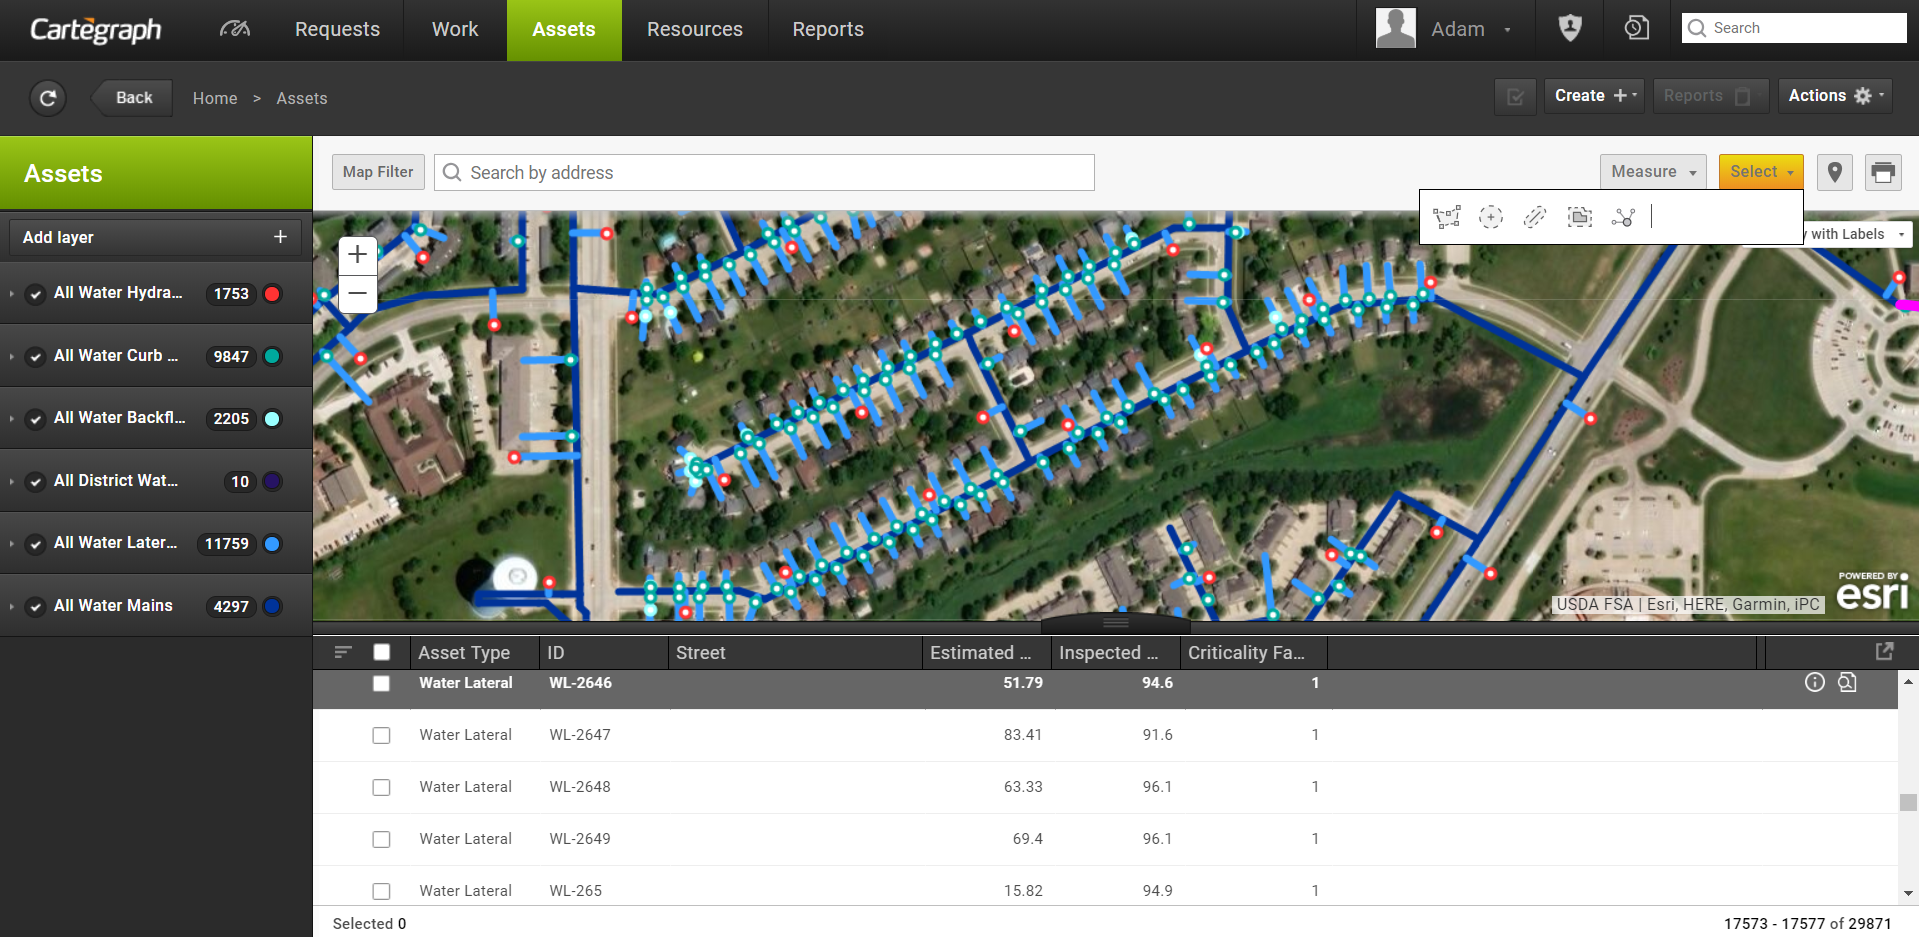
When using a Cartegraph map you can select a group of records through different tools in the Select menu, instead of manually selecting each record.
The Select tool is available in different maps:
- List view maps when a layer is turned on.
- Work Order Detail map when at least one Task status check box is selected.
- Container Component tab when at least one layer is turned on.
- Create Task from Request when an Asset type is selected (not Non-Asset).
The Select tool contains different tools. Once any of the tools are used, the selected records in the map display as selected in the List view. Sort Selected Records is turned on to bring the selected records to the top of the list.
Use the Draw Polygon tool to draw a polygon shape around records in the map.
Use the Radial Distance tool to select records within a certain distance from a point in the map.
Use the Linear Offset tool to select records within a certain distance from a linear record in the map.
Use the Polygon Offset tool to select records within a certain distance from a polygon record in the map.
Use the Spatial Analysis tool (only available on the Asset List view) to select records based on queries against other Cartegraph layers or Esri layers.
Map Measure Tools
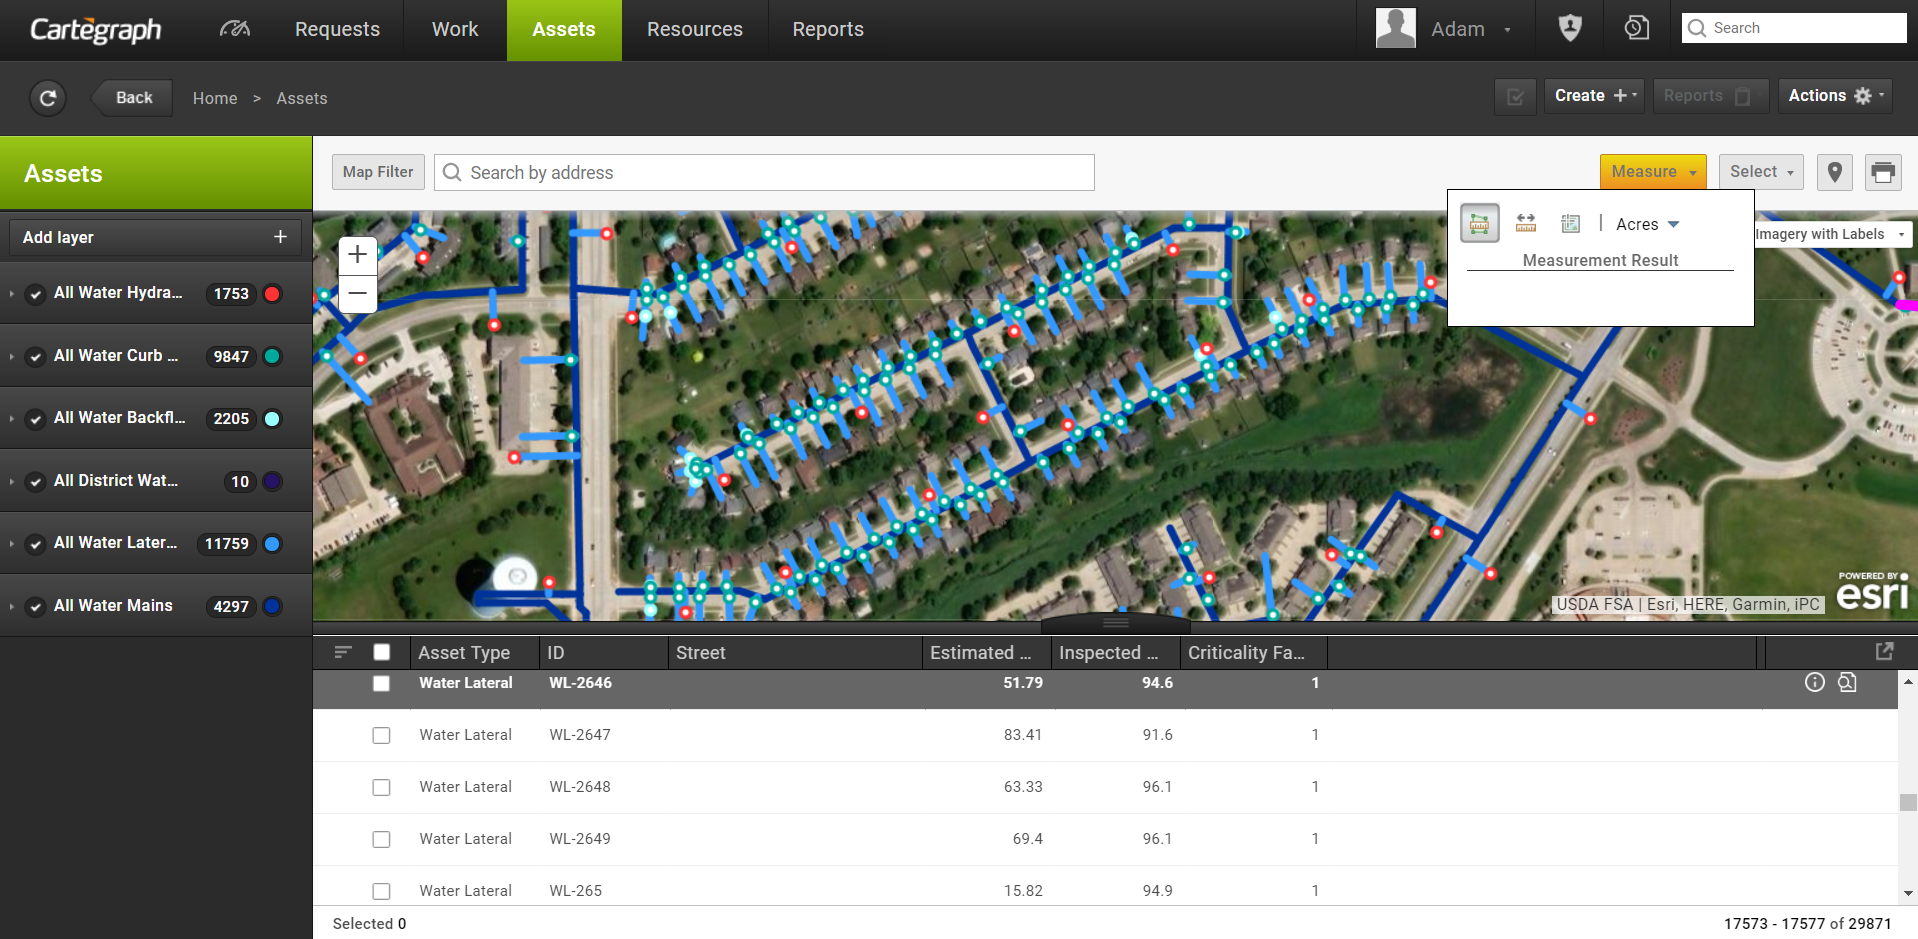
When using most maps in Cartegraph, you can measure the area of a polygon, the length of a line, or find the coordinates of a point.
Make a Measurement
- Click the Measure button to display the toolbar and use one of the measure options.
- To measure an area on the map, click and click the map once for every vertex of the area you want to measure. Double-click to complete the area.
- To measure a line on the map, click and click the map once for every vertex of the line you want to measure. Double-click to complete the line.
- To get coordinates for a point on the map, click and click the map at the location where you want to get coordinates.
- Your results display in the bottom of the toolbar.
- To turn off the Measure Tool, click the Measure button. Turning off the Measure Tool clears any previous measurement results.
Change the Units
Each option in the measurement tool has its own set of corresponding units.
Click the Unit field for the selected measurement option to change the unit of measurement. The selected units stay selected for each measurement tool.
Spatial Analysis
When using the map in the Assets page in Cartegraph, select assets based on a set of spatial or attribute queries run against other Cartegraph Asset layers and/or Esri layers in the map. The Spatial Analysis tool is available when Cartegraph is authenticated with ArcGIS Online or with Portal for ArcGIS configured with Data Store.
Target Layer
- The Target layer must be an active Cartegraph layer that contains at least one record with a location.
- The analysis returns records that are in the Target layer.
Analysis Layers
- All active Cartegraph asset layers can be used in the analysis as long as they contain at least one record with a location.
- Esri layers available for analysis come from the current map.
- Any layers in the map that support the analysis capability can be used.
- If the current map does not have any layers, then no Esri layers are available in the analysis. For example, the Streets map.
- The logged in user must have access to the layer, based on the corresponding Esri Authentication.
- Web Feature Services (WFS) layers are not supported in Cartegraph.
- Living Atlas
- The Living Atlas contains a set of free layers that are part of the ArcGIS Living Atlas of the World.
- To limit the number of maps available based on your current map extent, select the Within map area check box.
- To add a layer to your map temporarily, select the Add layer to map check box.
Expressions
- You must add at least one expression in order to run the analysis.
Analysis Results
The returned records are selected in the map and the index list.
- A maximum of 2,500 results can be selected in the List view. If more results are returned, a message displays the returned results count.
- Esri returns a maximum of 9,999 results.
To limit the results of the analysis to only the assets within the map window, select the Use current map extent check box.
NOTE: If the Map Filter is turned on in the Cartegraph map, the Use current map extent option cannot be cleared.
Credits
The Spatial Analysis feature consumes Esri credits. Use the layer filters and map filter to decrease the number of records in the layer to lower the consumption of credits.
*This feature requires an ArcGIS Identity.
Documents Attachments
Cartegraph allows you to attach many file types to any record or inspection. The attachments can provide more detail about Requests, Work Order, Task, Assets, Labor, Equipment, Material, Material Location, and Vendor records.
- Attachments can be uploaded or linked.
- More than one file can be attached to a record.
- After the file is linked or uploaded the file name becomes a hyperlink. Click the hyperlink and a new tab opens with the file.
- Filter a parent record using the attached file name.
- Image attachments automatically create a thumbnail file that is stored in the Project Home with the .cgthumb extension.
- Examples of valid attachment file types are pictures, documents, multimedia files, and websites.
- The valid file types are:
- Pictures (*.gif;*.jpg;*.jpeg;*.png, *.bmp)
- HTML (*.htm;*.html)
- Videos (*.wma;*.avi;*.mov;*.mpeg, *.mp4)
- Adobe PDF Files (*.pdf)
- Documents (*.doc; *.docx)
- Excel Files (*.xls; *.xlsx)
- Drawing (*.dwg; *.dgn; *.dwf)
- Text Files (*.txt; *.rtf)
- Audio Files (*.aac; *.mp3; *.wav; *.wma)
Link
The following is true for files attached using Link:
- Cannot be used as the primary avatar.
- Link must begin with http:// or https:// or ftp://.
- Links cannot be a local or UNC path.
- The avatar is the generic avatar for Linked attachments.
Upload
The following is true for files attached using Upload:
- Click Cancel Upload to cancel the upload process and the record is not attached to the record.
- Primary attached files display on reports.
- The default storage location for uploaded attachments is the Project Home attachments folder for each asset type, request, resource, task, and work order.
- The Project Home location must be available to the Web server for two-tier setup or the Application server for three-tier setup.
- The database stores a variable of the path and file name.
- The maximum uploaded file size allowed is 30 MB.
- When you delete a record, all uploaded attachments and thumbnails associated with it are removed from the Project Home.
- If you want to use the same file for different records, the file saves with _# added at the end of the file name.
- If the file name exists, _# is added at the end of the file name.
- A thumbnail file is created for image files when they are uploaded.
- Inspections do not have primary attachments.
- Inspection Attachments have their own Security Setting.
List View Data Export
Use the List View Export feature to:
- Analyze data
- Share data with another program
- Create budgeting reports
- Create charts and diagrams using a third-party tool
- From the List header, click to send records to a .CSV file to view in a third-party spreadsheet program.
- If some records are selected in List View, export only the selected records or all the records. If no records are selected, then all the records in the List view are exported.
- Exported data does not maintain formatting but is raw data. Save the file to a specified location in order to view/manipulate the data in the future.
- The file exports with the file name of the recordset and Export or Multiple and Export if exporting data from more than one recordset. For example, TaskExport.csv, BenchExport.csv, or MultipleExport.csv.
User Interface
- Analytics Dashboard
- Navigation Persistence
- Global Search
- Table of Contents/ Layers
- Map Tools
- Documents Attachments
- List View Data Export
- More Information…
Request Management
Work Management
- Work Orders
- Repeating Work Orders
- Tasks
- Activities
- Task Calendar
- Time Sheets
- Distribute Resources
- Task Triggers
- Preventative Maintenance
- More Information…
Asset Management & Analytics
Resource & Inventory Management
Report Management
Mobile Management
- Cartegraph for iPad and Cartegraph One Feature Comparison
- Cartegraph for iPad
- Cartegraph One
- More Information…
Workflow Management
System Management
- Structure Manager
- Library Manager
- Layout Manager
- Esri and Active Directory
- Security Role Administration
- System Licensing
- System Requirements
- More Information…