OpenGov EAM provides the ability to track any asset and its location, attributes, condition and work history including costs.
- Supports any asset type and any attribution including attribution category, sub-category, asset number, related numbers (e.g. serial, vendor, etc.), parent/child relationships, acquisition date, install date, disposal date, expected useful life, location, department, person asset is assigned to, GPS coordinates, unit of measure (e.g. lineal feet, cu. Meter).
- Maintains a complete asset history
- Allows for customized asset inspections
- Ability to aggregate assets into containers, accumulating costs and calculating overall condition for the container
- Ability to run spatial analysis queries against other assets and/or Esri GIS features
- Allows for unlimited attachments of any file type including images and documents.
- Honors linked asset relationships, such as water and sewer network assets.
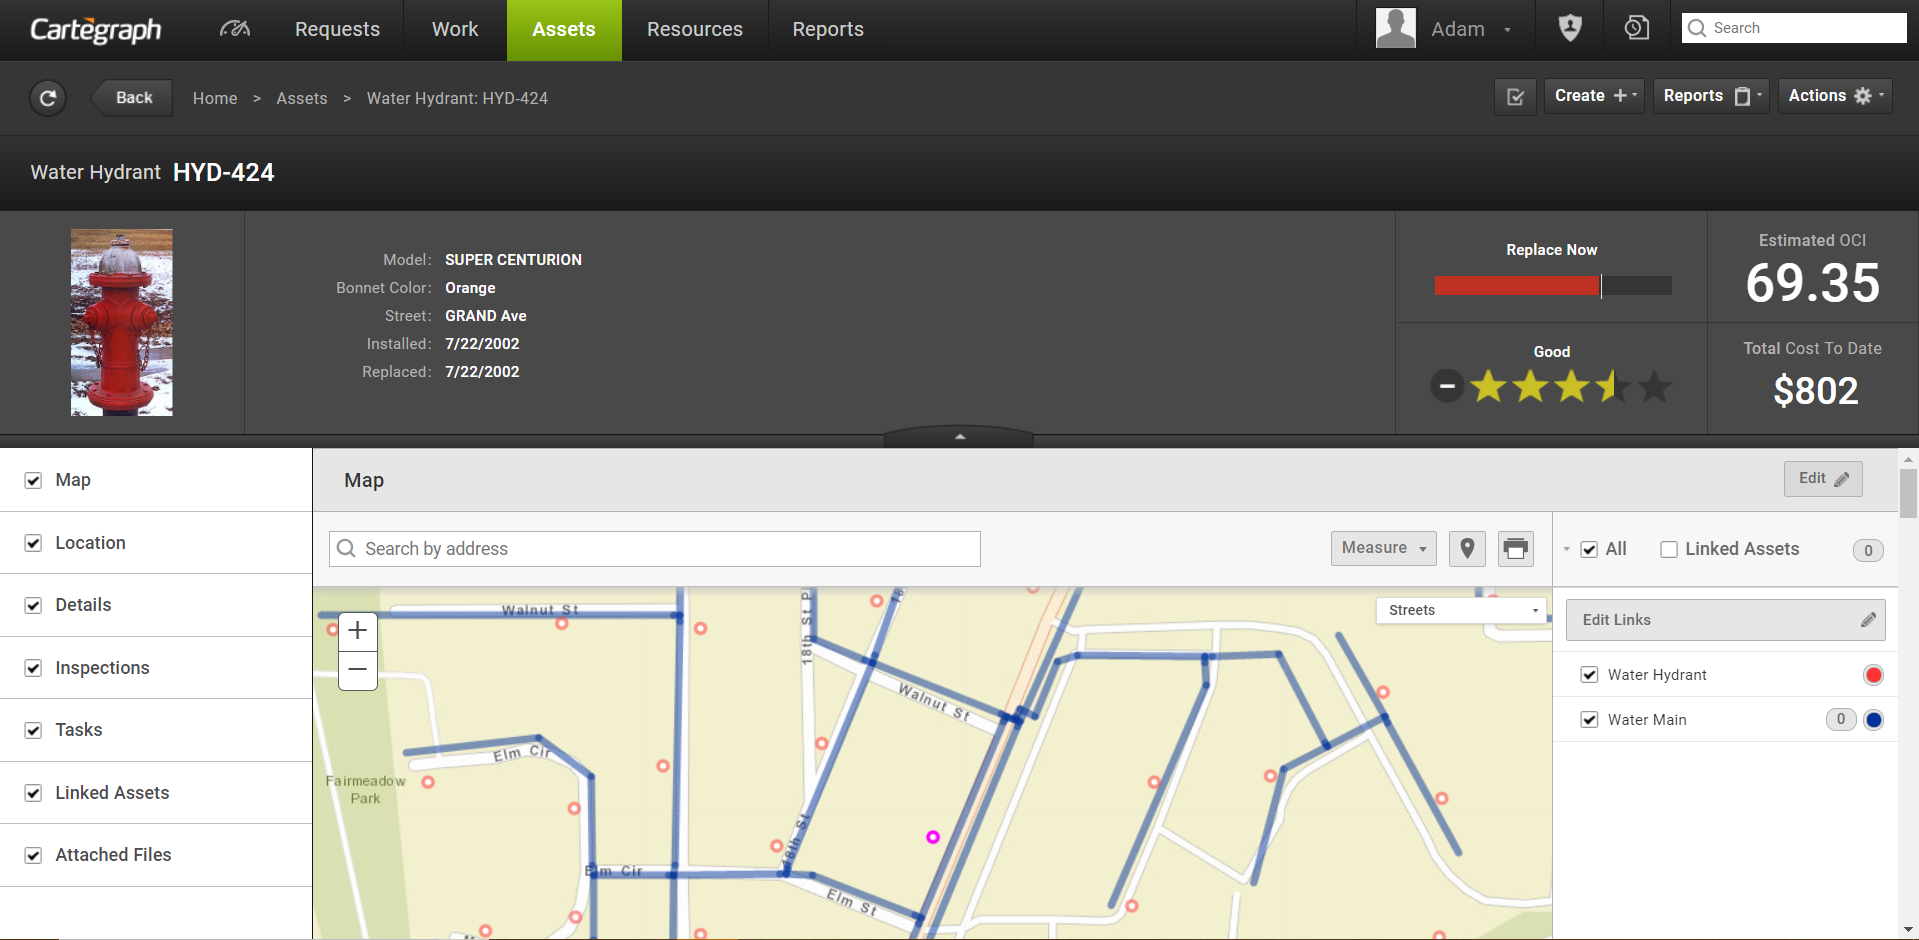
Linked Assets
OpenGov EAM provides the ability to track an asset and its location, attributes, and Tasks. Some assets are related to other assets and it is valuable to see those related assets and their details. The Linked assets feature’s benefit is interacting with the current asset and its linked assets.
NOTE: Standard asset connections are supported by OpenGov EAM, but building new connections requires an enterprise license.
There are three general ways assets are linked:
Networked
Each asset is linked to each other to form a network of connected assets. For example:
- Water distribution network: Pipes, Laterals, Hydrants, Valves, Fittings, etc.
- Sewer network: Mains, Laterals, Manholes, Treatment facilities, etc.
Referenced
An asset references a linked asset. For example:
- Sign on a support
- Lateral off a main
- Guard rail on a pavement segment
Hierarchical relationships
Assets are standalone, but are related through a physical component or geographical area. For example:
- Facilities with HVAC units, elevators, lighting, fire suppression equipment, etc.
- Parks with ball fields, parking lots, playground equipment, trees, etc.
- Signal cabinet with many subcomponents: circuit boards, conflict monitors, etc.
In OpenGov EAM there are two ways to link assets: through the map or a list. In the map view linked assets in the context of the current record. In the list view the attributes of many assets at one time. Together, both of these views give a full picture of an asset and its linked assets.
Container/ Component Asset Relationships
A container is an asset with component relationships established to other assets so that the cost and condition of the grouping of assets can be reflected as a complete unit. For example, University Park is the container and the assets inside the park, such as play structures, slides, swings, picnic tables, benches, courts, and pavilions are all component assets. With a container/component relationship, containers can also be connected to a different asset type.
For example, a play bridge is a component asset that is connected to a particular play structure. The play structure is a component asset itself, and is contained in the park.
Here’s how a container/component relationship might be applied to a public park:
- Records of individual park components—such as picnic tables—are related to their containing asset, University Park.
- If University Park contains other types of furniture—such as benches—those components can also be connected to the University Park container.
- The same connections can be created between University Park and any other component assets that reside and require management in it.
- Play equipment
- Trees
- Benches
Metrics regarding your container, associated requests and tasks, and contained assets can be found on the Summary tab of the container asset’s Detail view.
Summary Tab
The Summary tab is divided into four tabs, each displaying different metrics. All metrics are for the container asset and its connected components unless otherwise specified. Depending on the volume of components in the container, a wait spinner or a dash may display in calculated fields until the data is available to display.
Overview
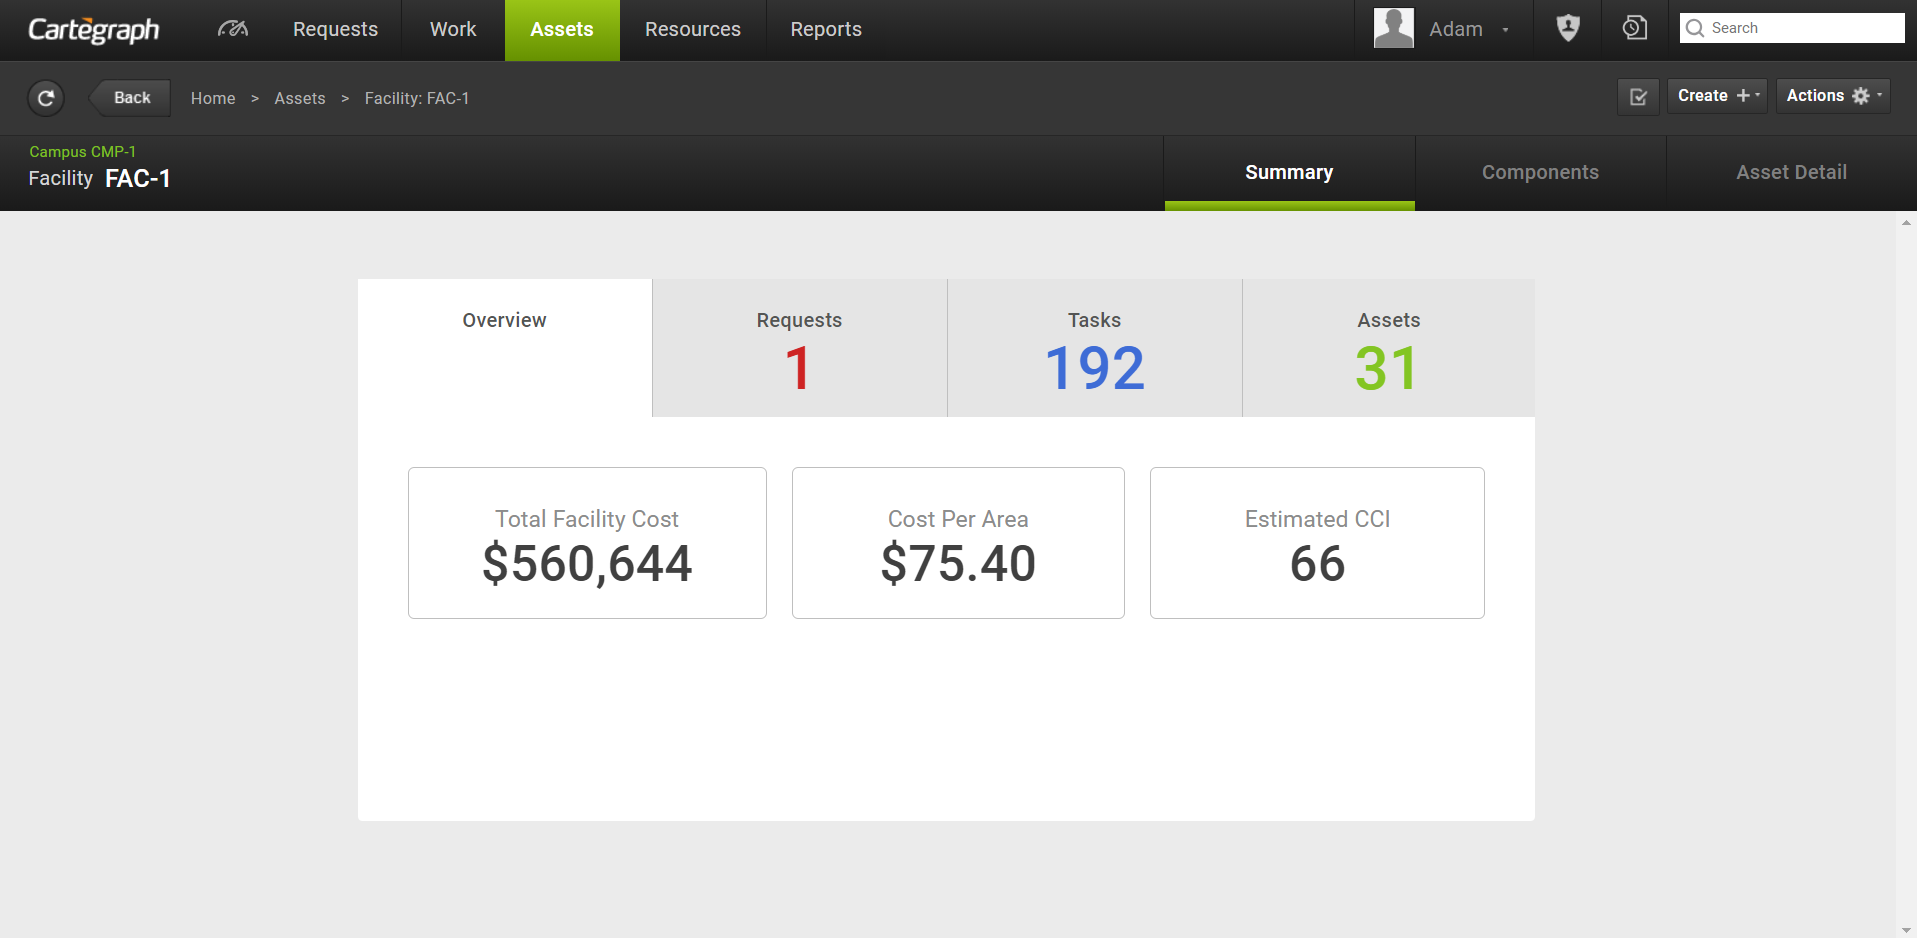
- The Overview tab metrics vary if the container is a facility:
- Facility metrics include total facility cost, cost per area and estimated CCI. The Cost per area is the total container/facility cost divided by facility size.
- For all other container assets, the metrics includes total container cost and estimated CCI.
- The total container/facility cost is the sum of the container asset cost and the costs for each component asset incurred while the component was connected to the container.
- Costs associated to the component asset before it is connected to a container are not included in the container total cost.
- Costs associated to the component asset remain with the container asset even if the component is moved to another container.
Requests
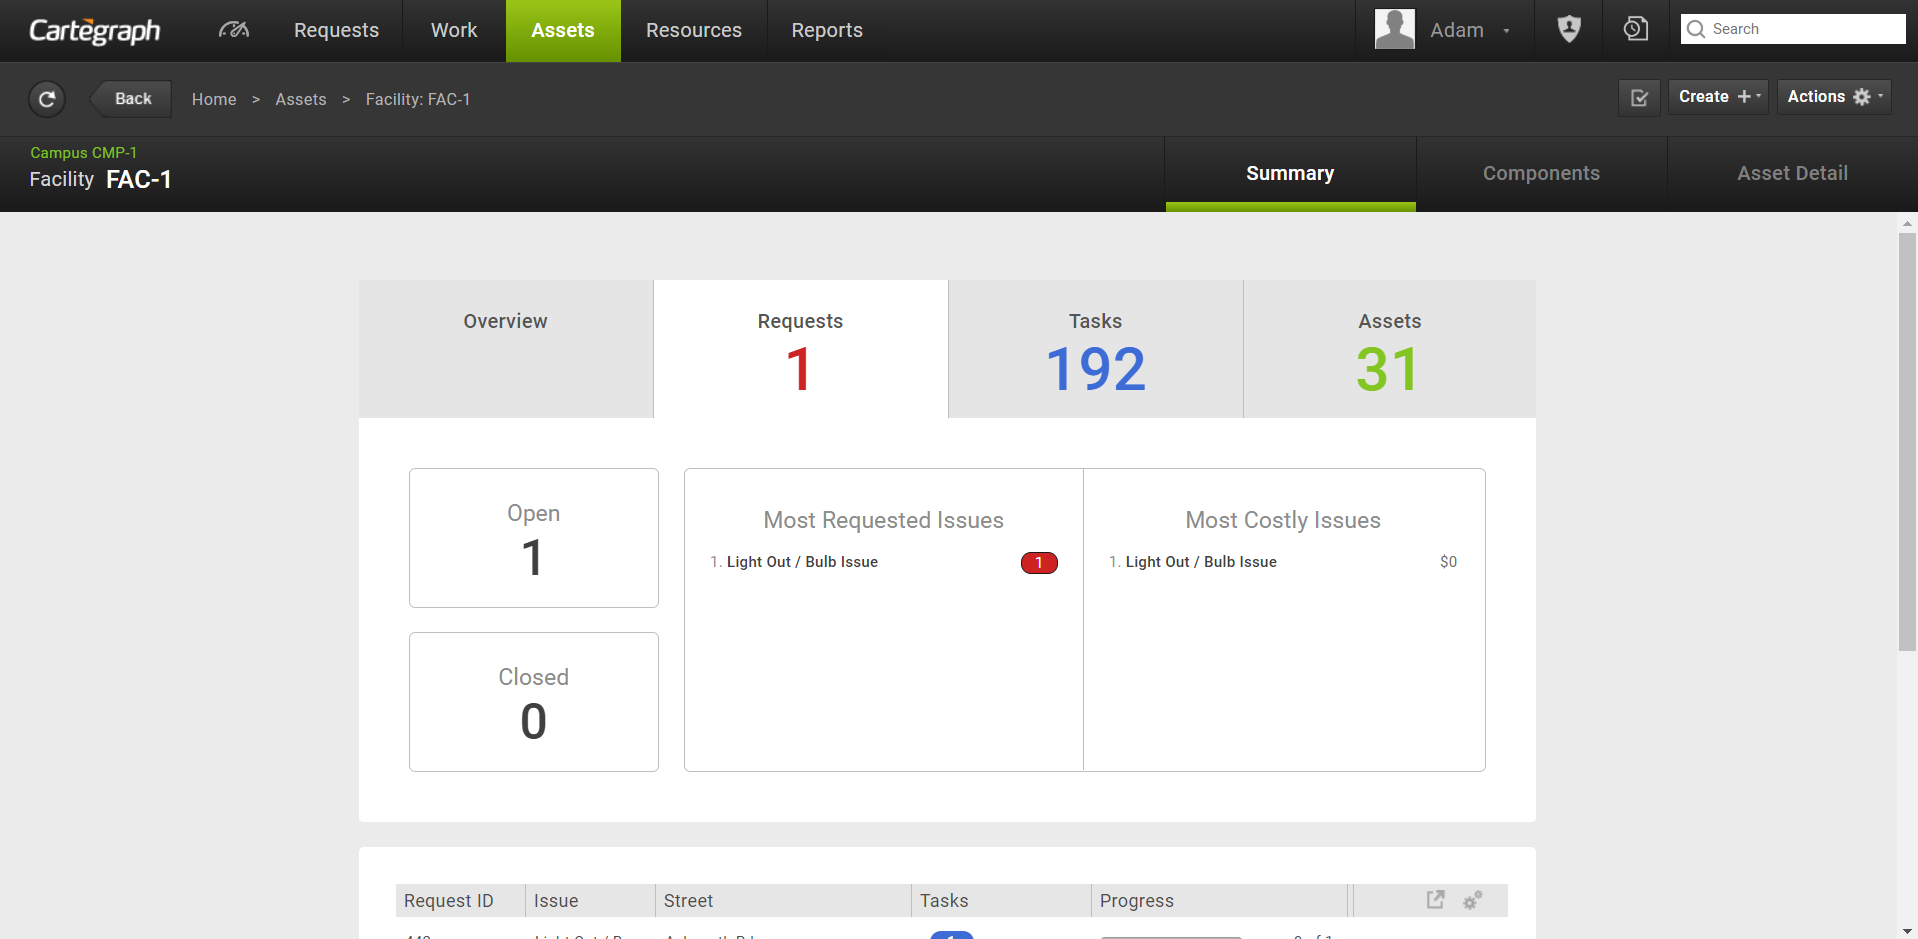
- Requests total displays in the Requests tab header. This value represents a count of the total unique requests for tasks associated to the container. If a request is related to more than one task, it is only counted once.
- Open and closed requests count
- The five most requested When two or more issues have the same count, they display alphabetically by Request issue name.
- The five most costly issues. When two or more issues have the same cost, they display alphabetically by Request issue name.
- List of Requests associated to Tasks. By default, the list displays the same columns as on the Requests List view. Changes made to columns selected, column size, or sorts persist to the Requests List view.
Tasks
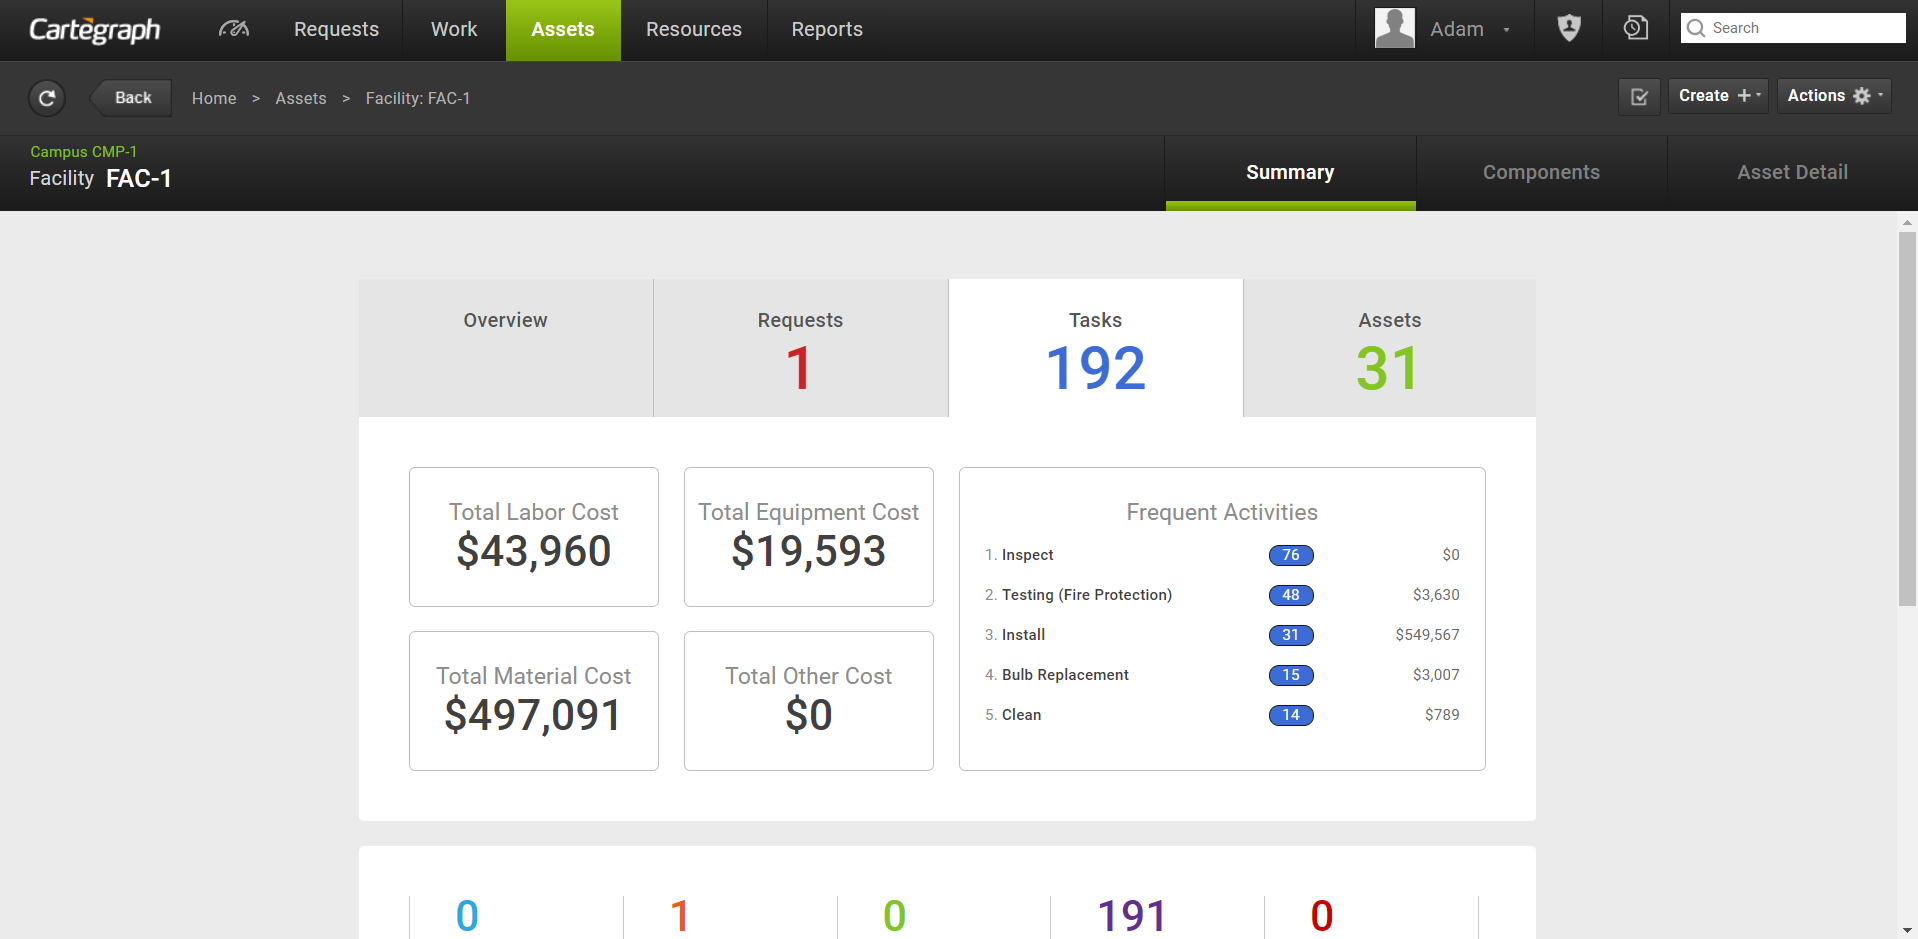
- Task total displays in the Tasks tab header.
- Total costs for Labor, Equipment, Material and Other.
- The five most frequently reported Task activities and their associated costs. When two activities have the same frequency of occurrence, they display highest to lowest cost, then alphabetically by name if costs are also the same.
- List of Tasks, filterable by status. By default, the list displays the same columns as on the Asset Detail tab. Once changed, the column selections in the list remain until the user’s persistence is reset.
Assets
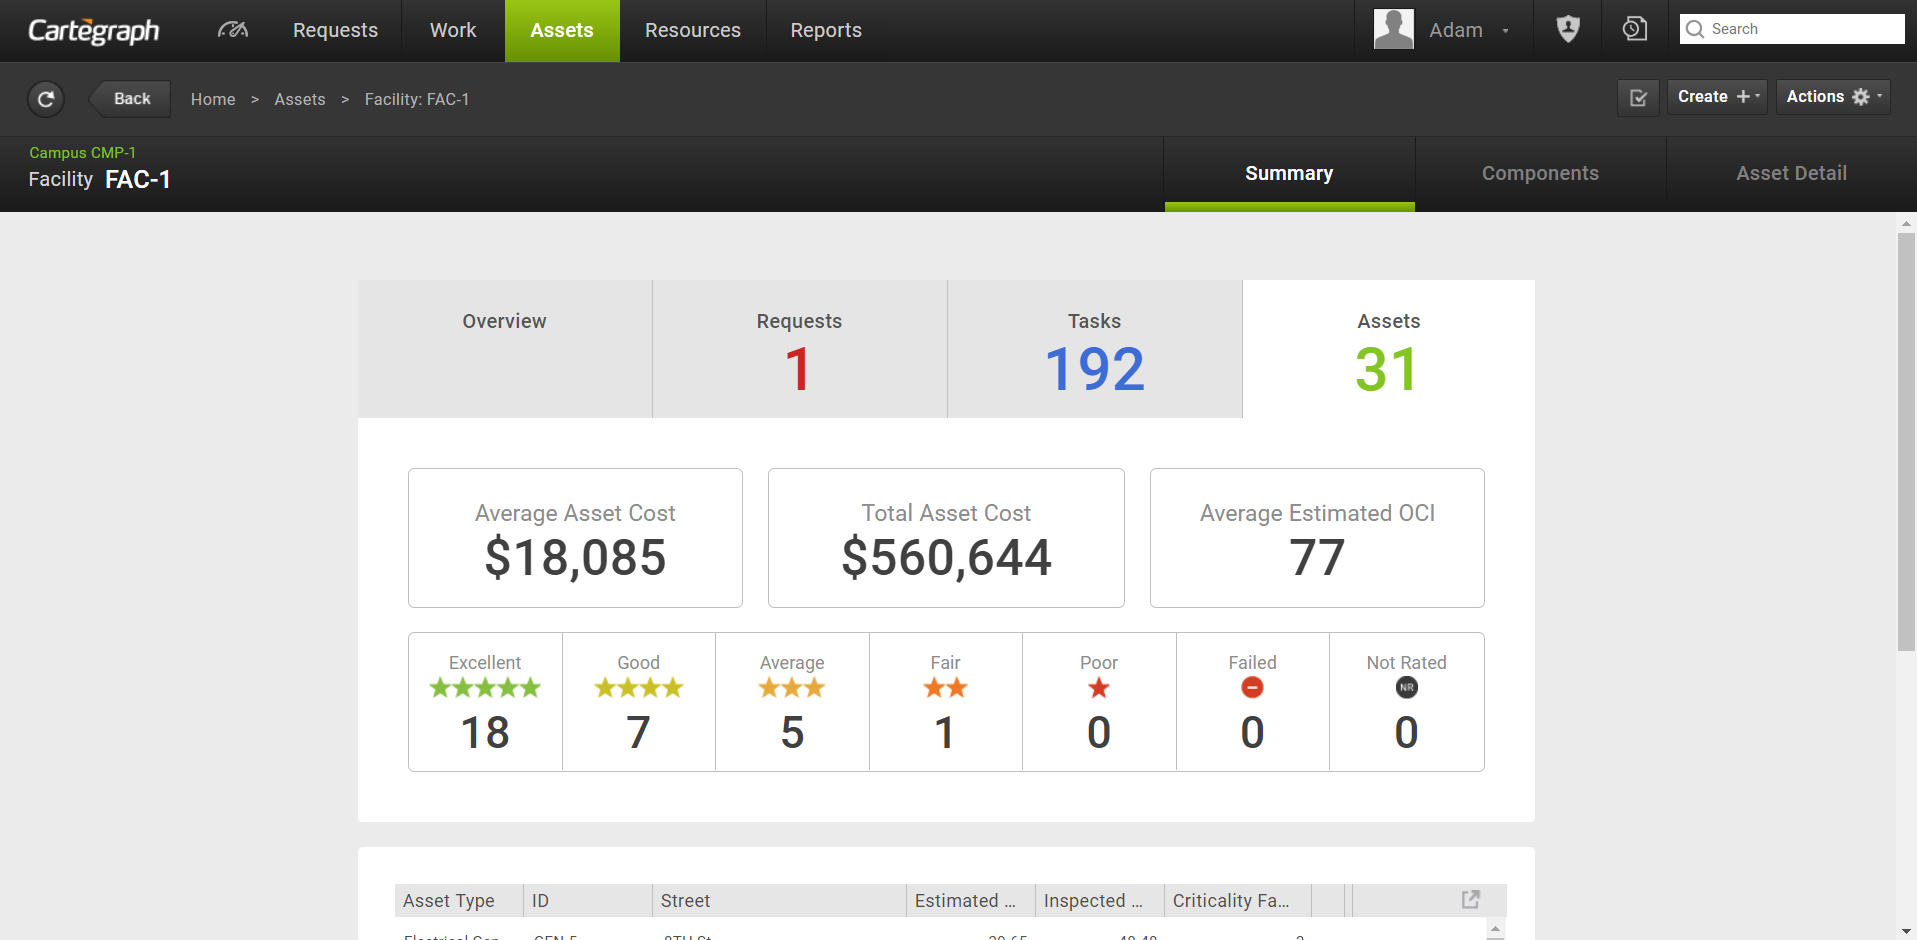
- Total asset count of the container and its components displays in the Assets tab header. If a component asset is disconnected from the container, it is no longer reflected in the Assets count, whether or not it has tasks still included in the container Task list. To see the Component asset list, go to the Components tab for the Container asset.
- Average asset cost is the total asset cost divided by total asset count.
- Total asset cost is the cost of all currently connected assets regardless of when the asset costs were incurred. This may be different than the total container cost on the Overview tab. Costs for assets removed from the container are no longer included in this value.
- Average Estimated OCI is the sum of all Estimated OCI values divided by total assets. If an asset does not have a estimated OCI rating, it is not counted.
- Asset count for each asset condition rating.
- Asset count for assets not inspected.
- List of Assets in the container. The List view count matches the asset count in the Assets tab header. By default, the list displays the same columns as on the Assets index list view. Changes made to columns selected, column size, or sorts persist to the Asset’s List view.
Components Tab
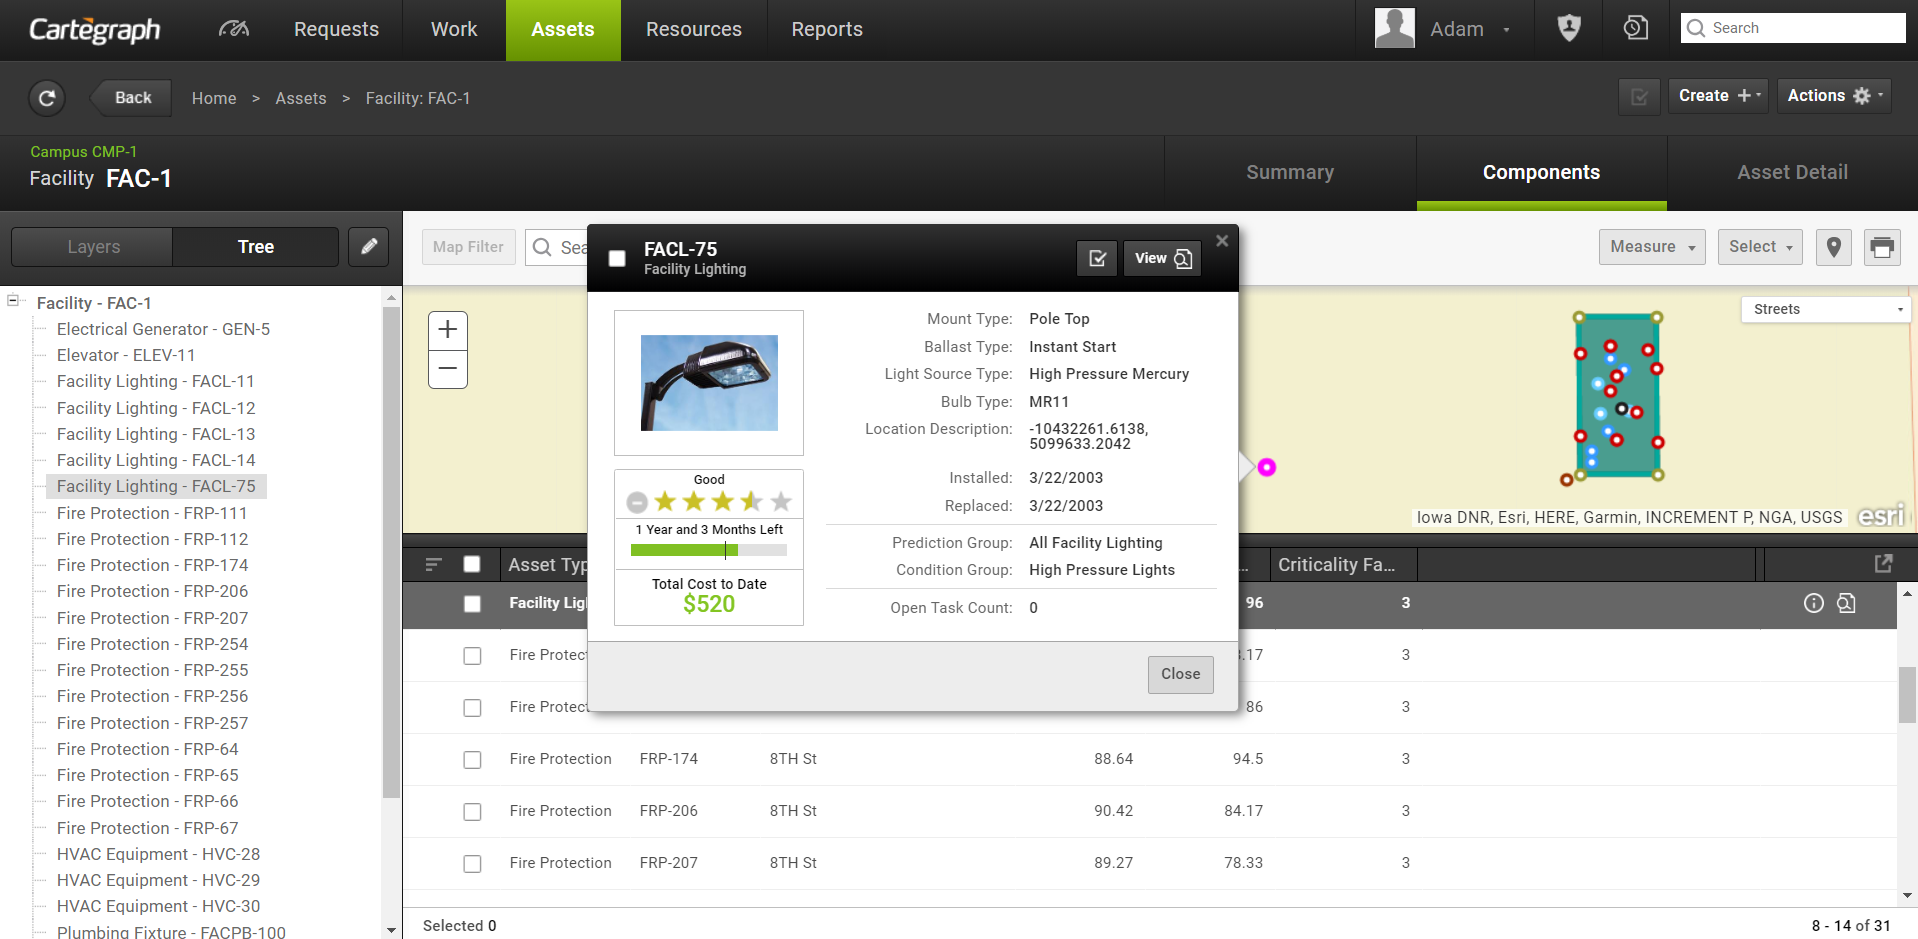
The Components tab includes the Layers and Tree tab seen in the left side of the above image:
- The Layers tab displays all the component assets, their asset count, and layer color.
- The Tree tab displays a tree view of all the components in a hierarchy format.
Asset Detail Tab
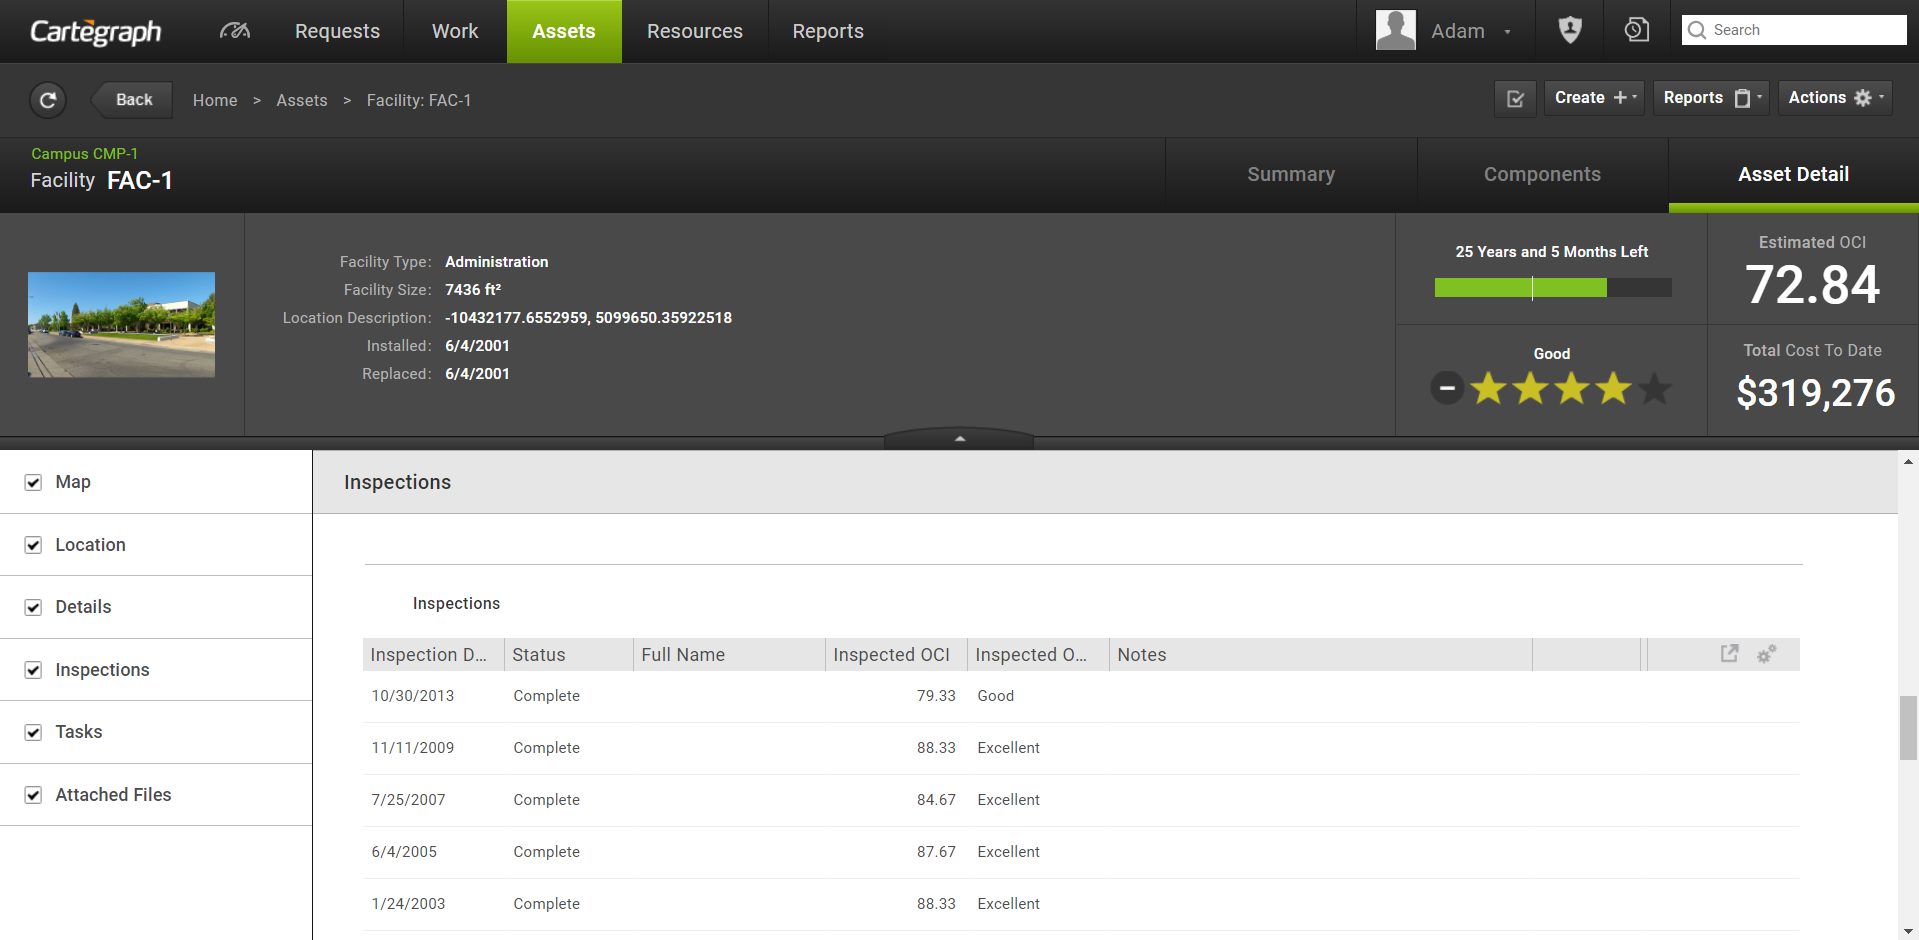
The Asset Detail tab displays the same information for all Assets in the Detail view. For example, location information, relevant dates, OCI, and total cost.
User Interface
- Analytics Dashboard
- Navigation Persistence
- Global Search
- Table of Contents/ Layers
- Map Tools
- Documents Attachments
- List View Data Export
- More Information…
Request Management
Work Management
- Work Orders
- Repeating Work Orders
- Tasks
- Activities
- Task Calendar
- Time Sheets
- Distribute Resources
- Task Triggers
- Preventative Maintenance
- More Information…
Asset Management & Analytics
Resource & Inventory Management
Report Management
Mobile Management
Workflow Management
System Management
- Structure Manager
- Library Manager
- Layout Manager
- Esri and Active Directory
- Security Role Administration
- System Licensing
- System Requirements
- More Information…