Report Types
Report types apply to both Basic and Advanced reports. The Type selected for a report determines the location in which the report is available in OMS. For example, a pavement report crated on the Reports tab will be available under the Pavement section after it has been saved. All recordsets, child recordsets, and libraries are available no matter which type is selected.
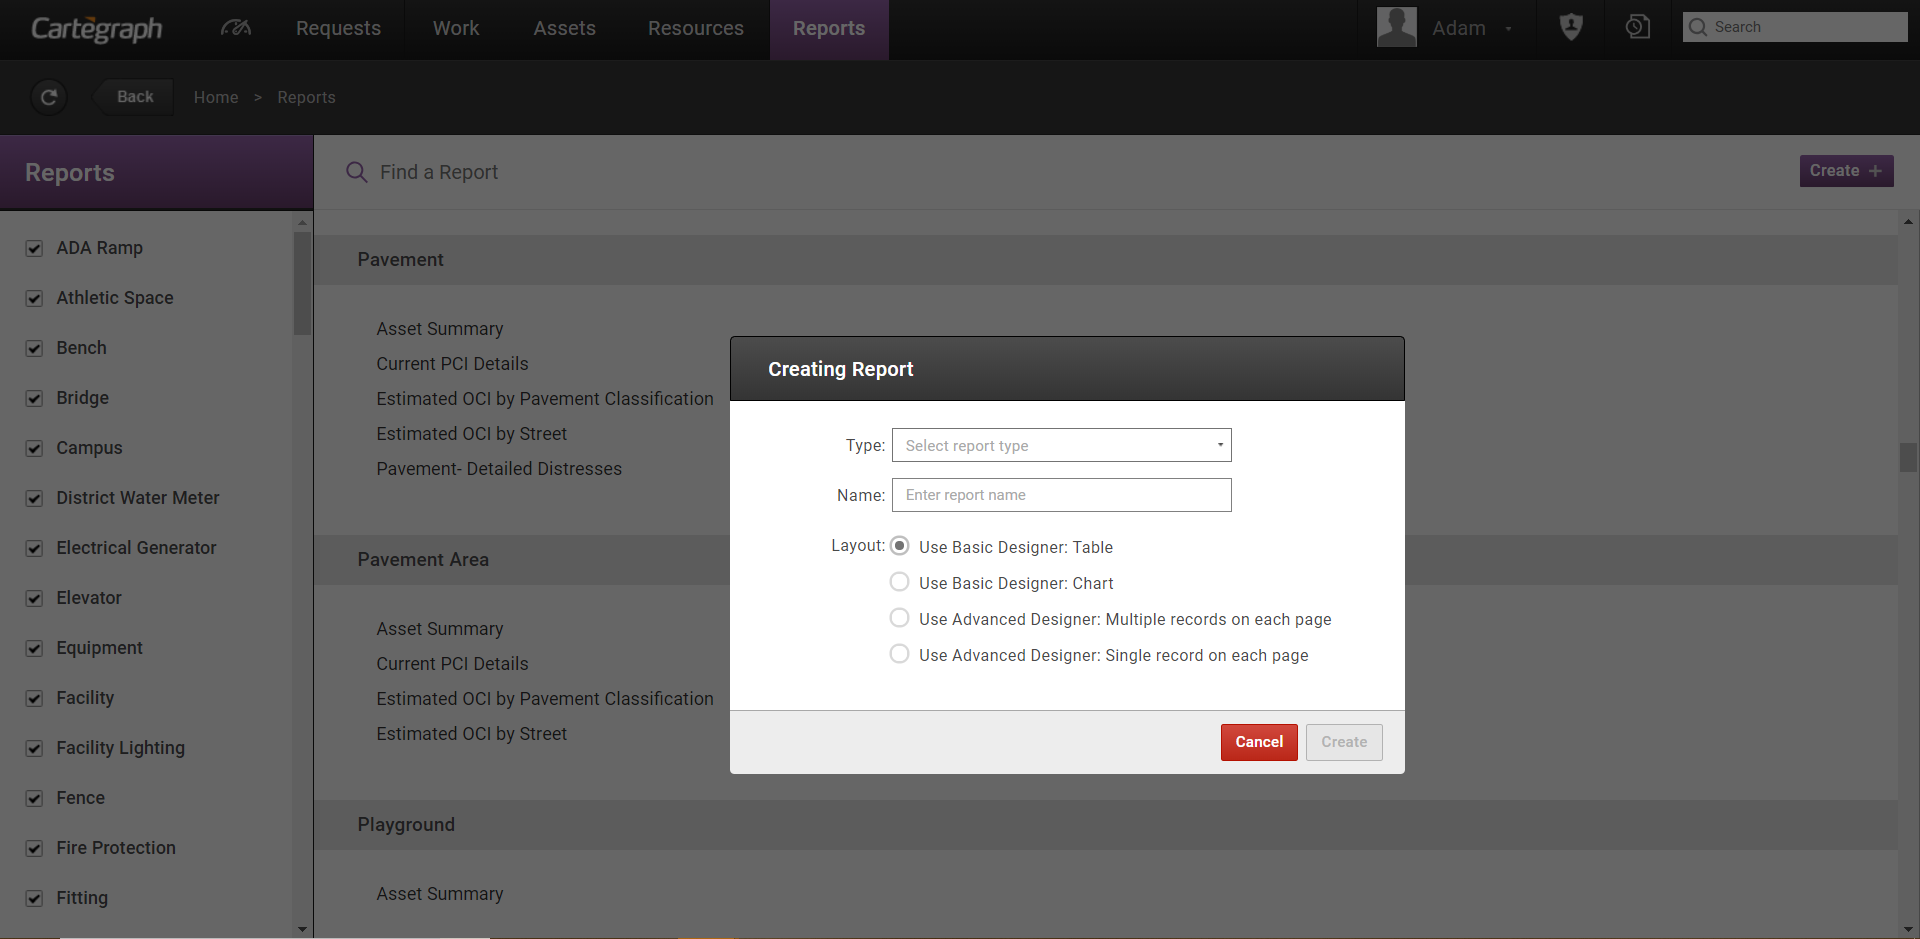
Basic
The Basic Designer allows simple table or chart reports to be quickly created. The functionality focuses on common features. A report created with the Basic Report designer can be edited with the Advanced Report designer. Once a report is edited in the Advanced Report designer, the report can no longer be edited in the Basic Designer again.
When creating a table report using the Basic Report Designer, select the recordset and columns to include in the table. Once the data is selected to display, each column of data can be configured. Configure how each column displays and if any values should be aggregated in a footer such as counts, sums, and averages. Layout parameters, sorting, and grouping of the reported data can also be set. To reduce the records displayed in the table, set a filter for the report.
When creating a chart report using the Basic Report Designer, select the recordset and chart type for the report. Once the chart type is selected, select the data to display. To reduce the record display in the chart, set a filter for the report.
Advanced
- Run reports from the List, Detail, and Report views. Not all reports are available in each view.
- When you run a report from the Detail view, the report includes information for that individual record.
- When you run a report from the Index view, the report includes information for the records selected on the list.
- When you run a report from the Reports view, the report includes all records that apply to the report.
- When you create a report, it can be stored in the Index, Detail, and/or Report View folders in the Project Home.
- Export reports to a different format. For example, a PDF.
- Add parameters to reports to act like filters when viewing a report.
Standard Reports vs. Custom Reports
Standard Reports are any reports delivered by Cartegraph.
- These files have an extension of. mrt or .srt in the Project Home.
- Standard Reports cannot be deleted, edited, or renamed through Cartegraph OMS.
- In the Report Viewer, the Edit and Delete buttons are disabled, and there is no Rename capability.
To edit a standard report, duplicate it and edit the duplicated version.
Custom Reports are any reports created by the customer.
- These files have an extension of .mrtx or .srtx in the Project Home.
- If a Standard report is duplicated, the duplicated report is a Custom report.
User Interface
- Analytics Dashboard
- Navigation Persistence
- Global Search
- Table of Contents/ Layers
- Map Tools
- Documents Attachments
- List View Data Export
- More Information…
Request Management
Work Management
- Work Orders
- Repeating Work Orders
- Tasks
- Activities
- Task Calendar
- Time Sheets
- Distribute Resources
- Task Triggers
- Preventative Maintenance
- More Information…
Asset Management & Analytics
Resource & Inventory Management
Report Management
Mobile Management
- Cartegraph for iPad and Cartegraph One Feature Comparison
- Cartegraph for iPad
- Cartegraph One
- More Information…
Workflow Management
System Management
- Structure Manager
- Library Manager
- Layout Manager
- Esri and Active Directory
- Security Role Administration
- System Licensing
- System Requirements
- More Information…