The OpenGov EAM is unique in that performance curves, daily maintenance, rehabilitation work, and inspections, defined and captured using the OpenGov EAM, are all leveraged to produce “real-time” analytical results. The OpenGov EAM provides the ability to track an unlimited number of assets of any type. Out-of-the-Box, OpenGov EAM includes 65+ predefined asset types.
Records
OpenGov EAM provides the ability to track any asset and its location, attributes, condition and work history including costs.
- Supports any asset type and any attribution including attribution category, sub-category, asset number, related numbers (e.g. serial, vendor, etc.), parent/child relationships, acquisition date, install date, disposal date, expected useful life, location, department, person asset is assigned to, GPS coordinates, unit of measure (e.g. lineal feet, cu. Meter).
- Maintains a complete asset history
- Allows for customized asset inspections
- Ability to aggregate assets into containers, accumulating costs and calculating overall condition for the container
- Ability to run spatial analysis queries against other assets and/or Esri GIS features
- Allows for unlimited attachments of any file type including images and documents.
- Honors linked asset relationships, such as water and sewer network assets.
Linked Assets
OpenGov EAM provides the ability to track an asset and its location, attributes, and Tasks. Some assets are related to other assets and it is valuable to see those related assets and their details. The Linked assets feature’s benefit is interacting with the current asset and its linked assets.
NOTE: Standard asset connections are supported by OpenGov EAM, but building new connections requires an enterprise license.
There are three general ways assets are linked:
Networked
Each asset is linked to each other to form a network of connected assets. For example:
- Water distribution network: Pipes, Laterals, Hydrants, Valves, Fittings, etc.
- Sewer network: Mains, Laterals, Manholes, Treatment facilities, etc.
Referenced
An asset references a linked asset. For example:
- Sign on a support
- Lateral off a main
- Guard rail on a pavement segment
Hierarchical relationships
Assets are standalone, but are related through a physical component or geographical area. For example:
- Facilities with HVAC units, elevators, lighting, fire suppression equipment, etc.
- Parks with ball fields, parking lots, playground equipment, trees, etc.
- Signal cabinet with many subcomponents: circuit boards, conflict monitors, etc.
In OpenGov EAM there are two ways to link assets: through the map or a list. In the map view linked assets in the context of the current record. In the list view the attributes of many assets at one time. Together, both of these views give a full picture of an asset and its linked assets.
Container/ Component Asset Relationships
A container is an asset with component relationships established to other assets so that the cost and condition of the grouping of assets can be reflected as a complete unit. For example, University Park is the container and the assets inside the park, such as play structures, slides, swings, picnic tables, benches, courts, and pavilions are all component assets. With a container/component relationship, containers can also be connected to a different asset type.
For example, a play bridge is a component asset that is connected to a particular play structure. The play structure is a component asset itself, and is contained in the park.
Here’s how a container/component relationship might be applied to a public park:
- Records of individual park components—such as picnic tables—are related to their containing asset, University Park.
- If University Park contains other types of furniture—such as benches—those components can also be connected to the University Park container.
- The same connections can be created between University Park and any other component assets that reside and require management in it.
- Play equipment
- Trees
- Benches
Metrics regarding your container, associated requests and tasks, and contained assets can be found on the Summary tab of the container asset’s Detail view.
Summary Tab
The Summary tab is divided into four tabs, each displaying different metrics. All metrics are for the container asset and its connected components unless otherwise specified. Depending on the volume of components in the container, a wait spinner or a dash may display in calculated fields until the data is available to display.
Overview
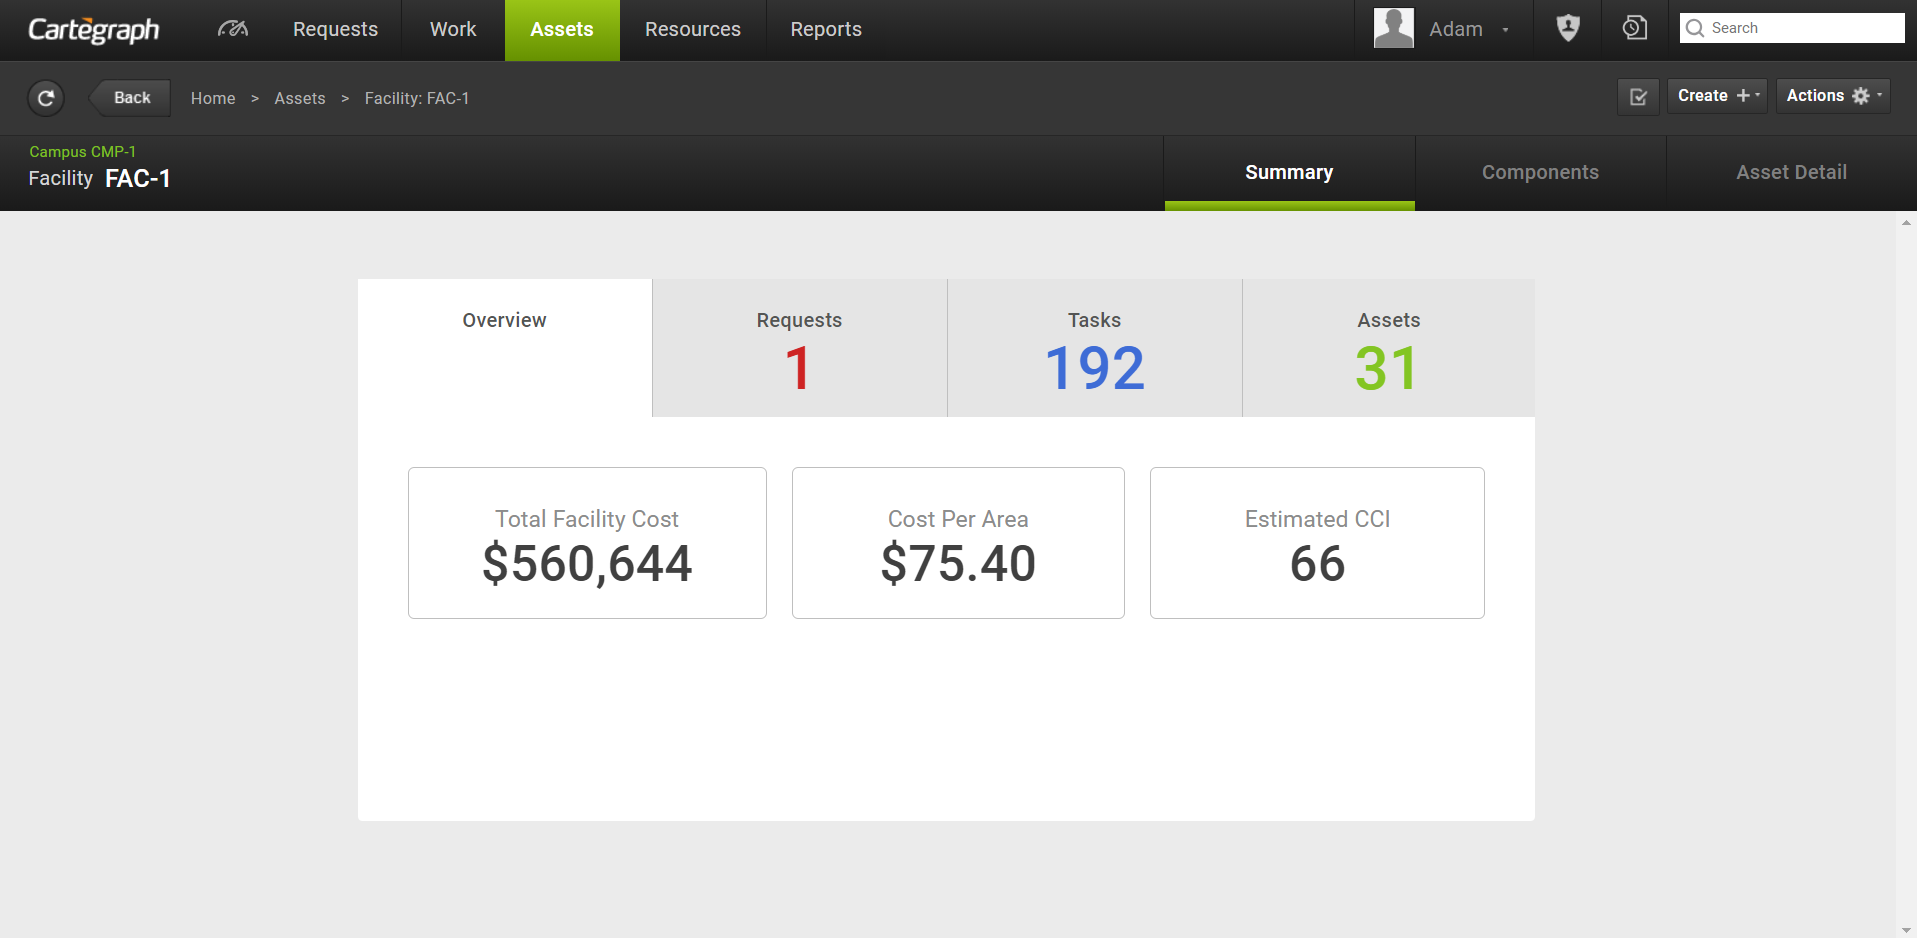
- The Overview tab metrics vary if the container is a facility:
- Facility metrics include total facility cost, cost per area and estimated CCI. The Cost per area is the total container/facility cost divided by facility size.
- For all other container assets, the metrics includes total container cost and estimated CCI.
- The total container/facility cost is the sum of the container asset cost and the costs for each component asset incurred while the component was connected to the container.
- Costs associated to the component asset before it is connected to a container are not included in the container total cost.
- Costs associated to the component asset remain with the container asset even if the component is moved to another container.
Requests
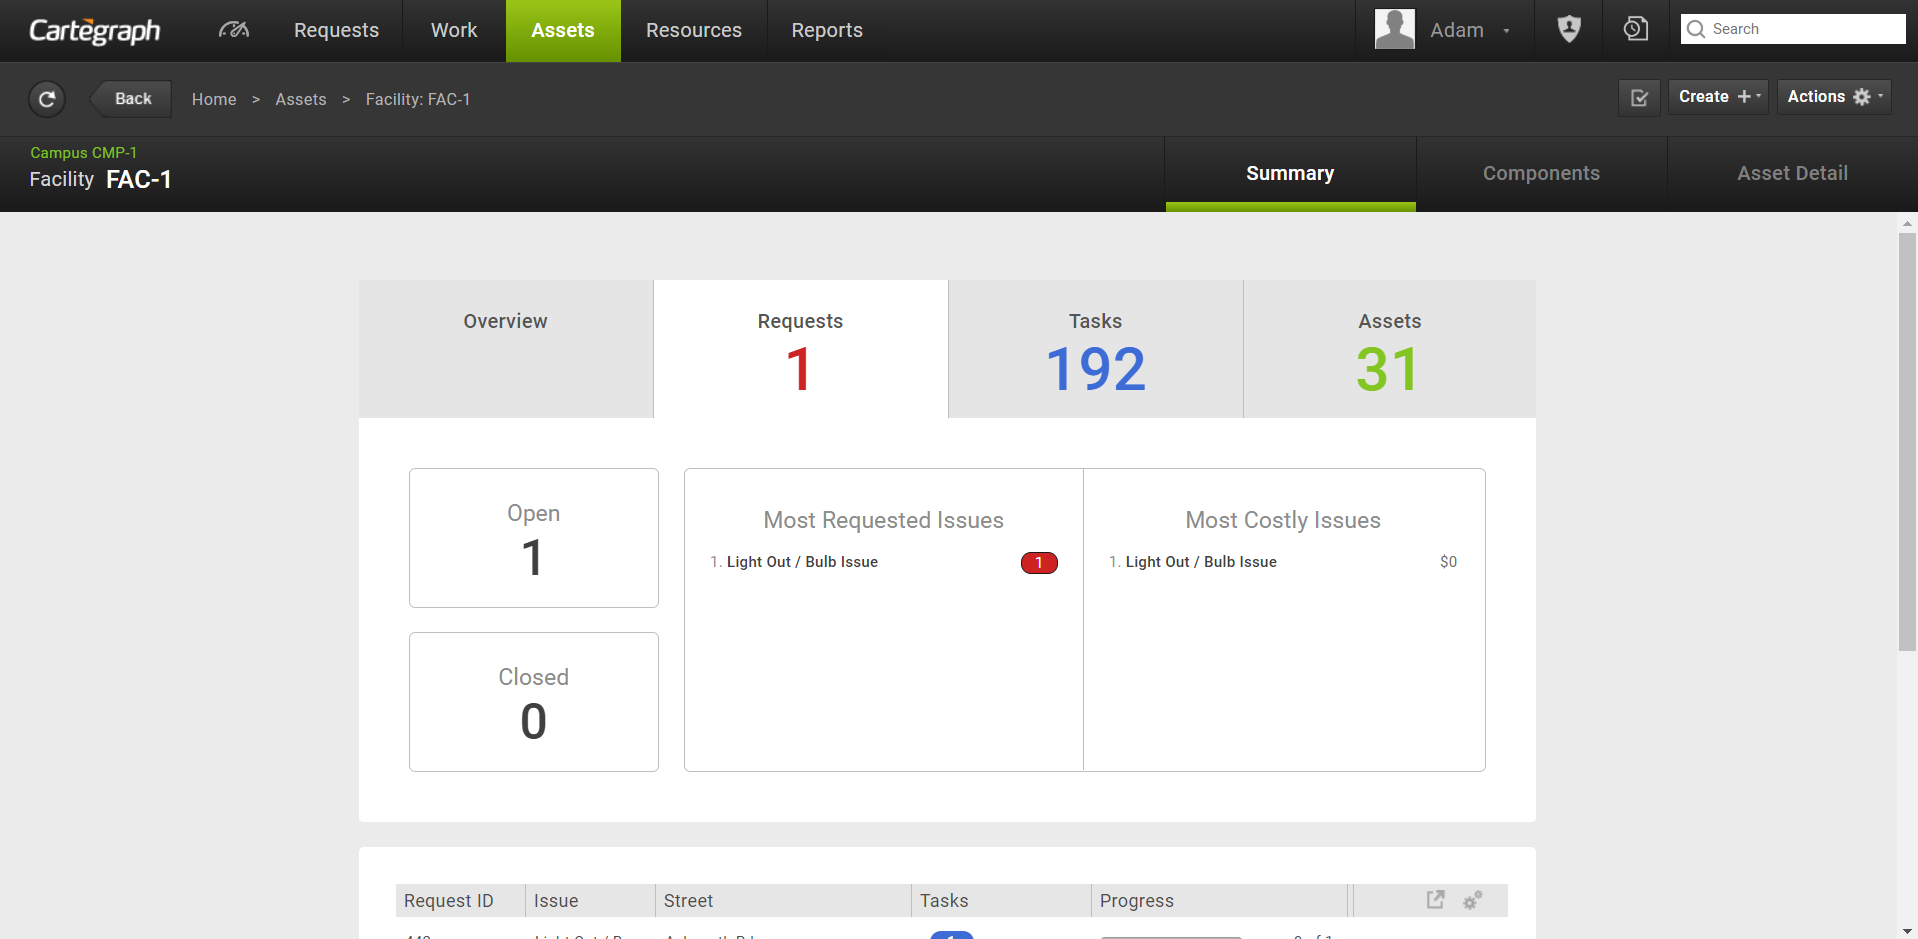
- Requests total displays in the Requests tab header. This value represents a count of the total unique requests for tasks associated to the container. If a request is related to more than one task, it is only counted once.
- Open and closed requests count
- The five most requested When two or more issues have the same count, they display alphabetically by Request issue name.
- The five most costly issues. When two or more issues have the same cost, they display alphabetically by Request issue name.
- List of Requests associated to Tasks. By default, the list displays the same columns as on the Requests List view. Changes made to columns selected, column size, or sorts persist to the Requests List view.
Tasks
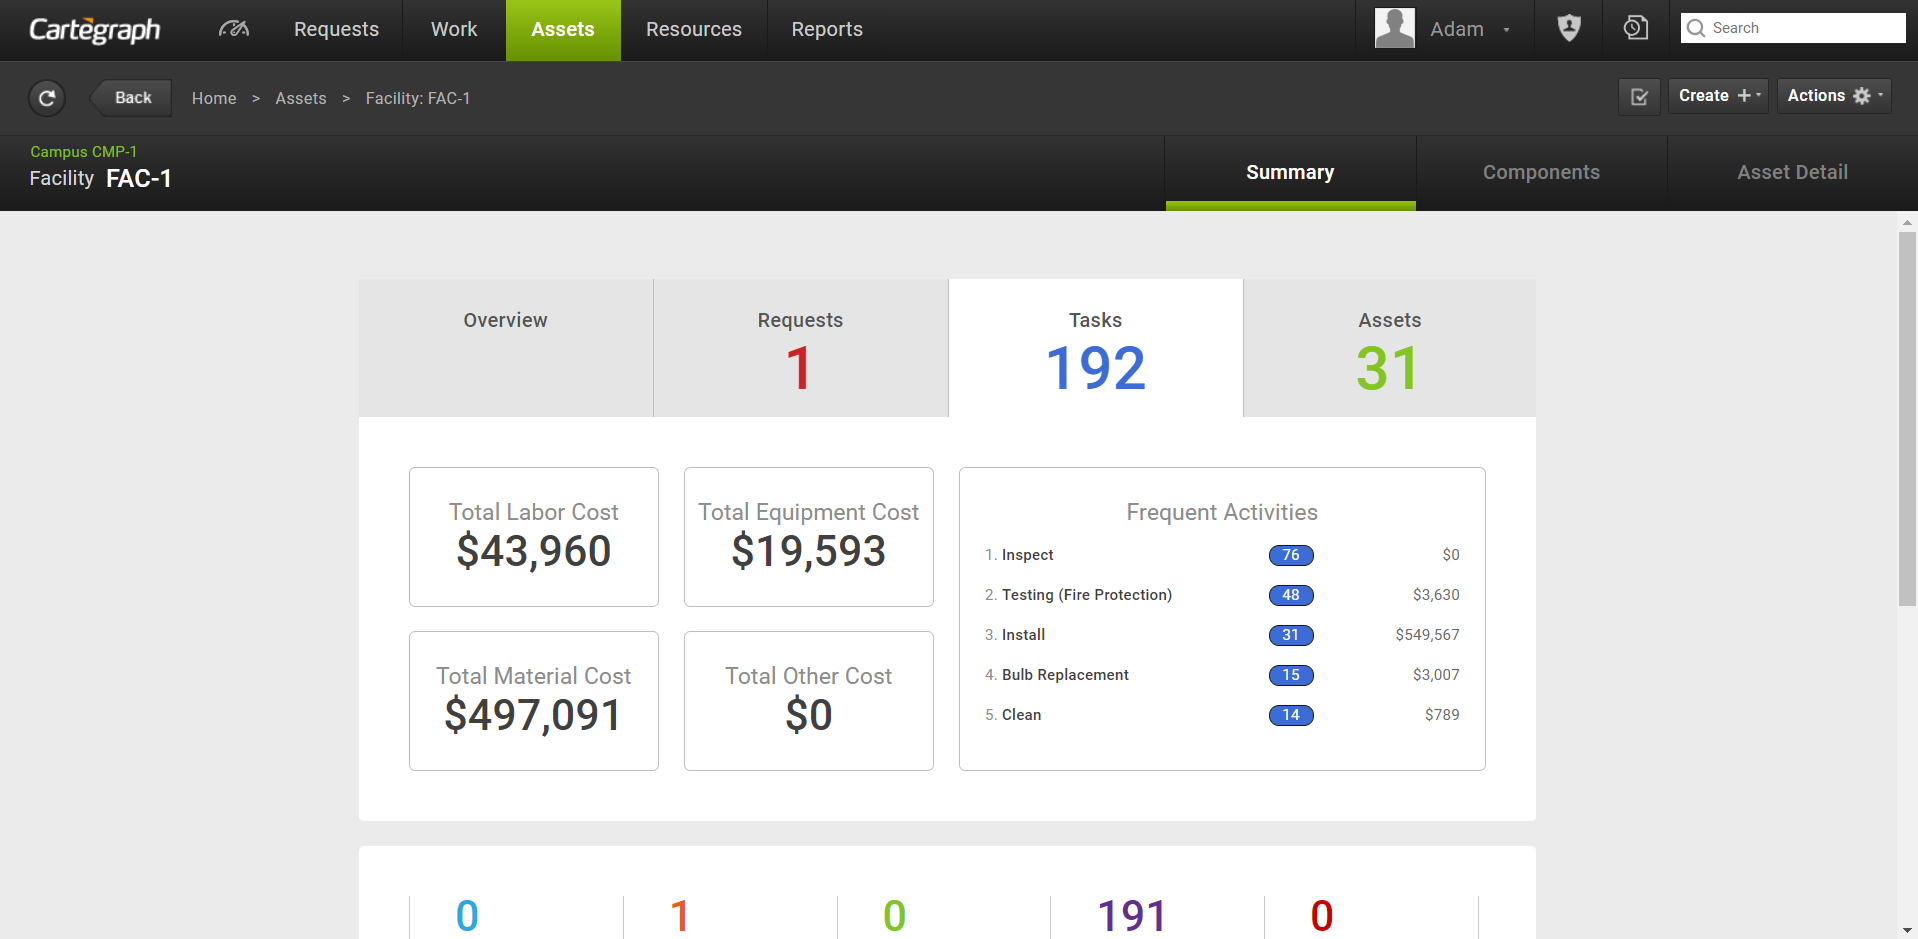
- Task total displays in the Tasks tab header.
- Total costs for Labor, Equipment, Material and Other.
- The five most frequently reported Task activities and their associated costs. When two activities have the same frequency of occurrence, they display highest to lowest cost, then alphabetically by name if costs are also the same.
- List of Tasks, filterable by status. By default, the list displays the same columns as on the Asset Detail tab. Once changed, the column selections in the list remain until the user’s persistence is reset.
Assets
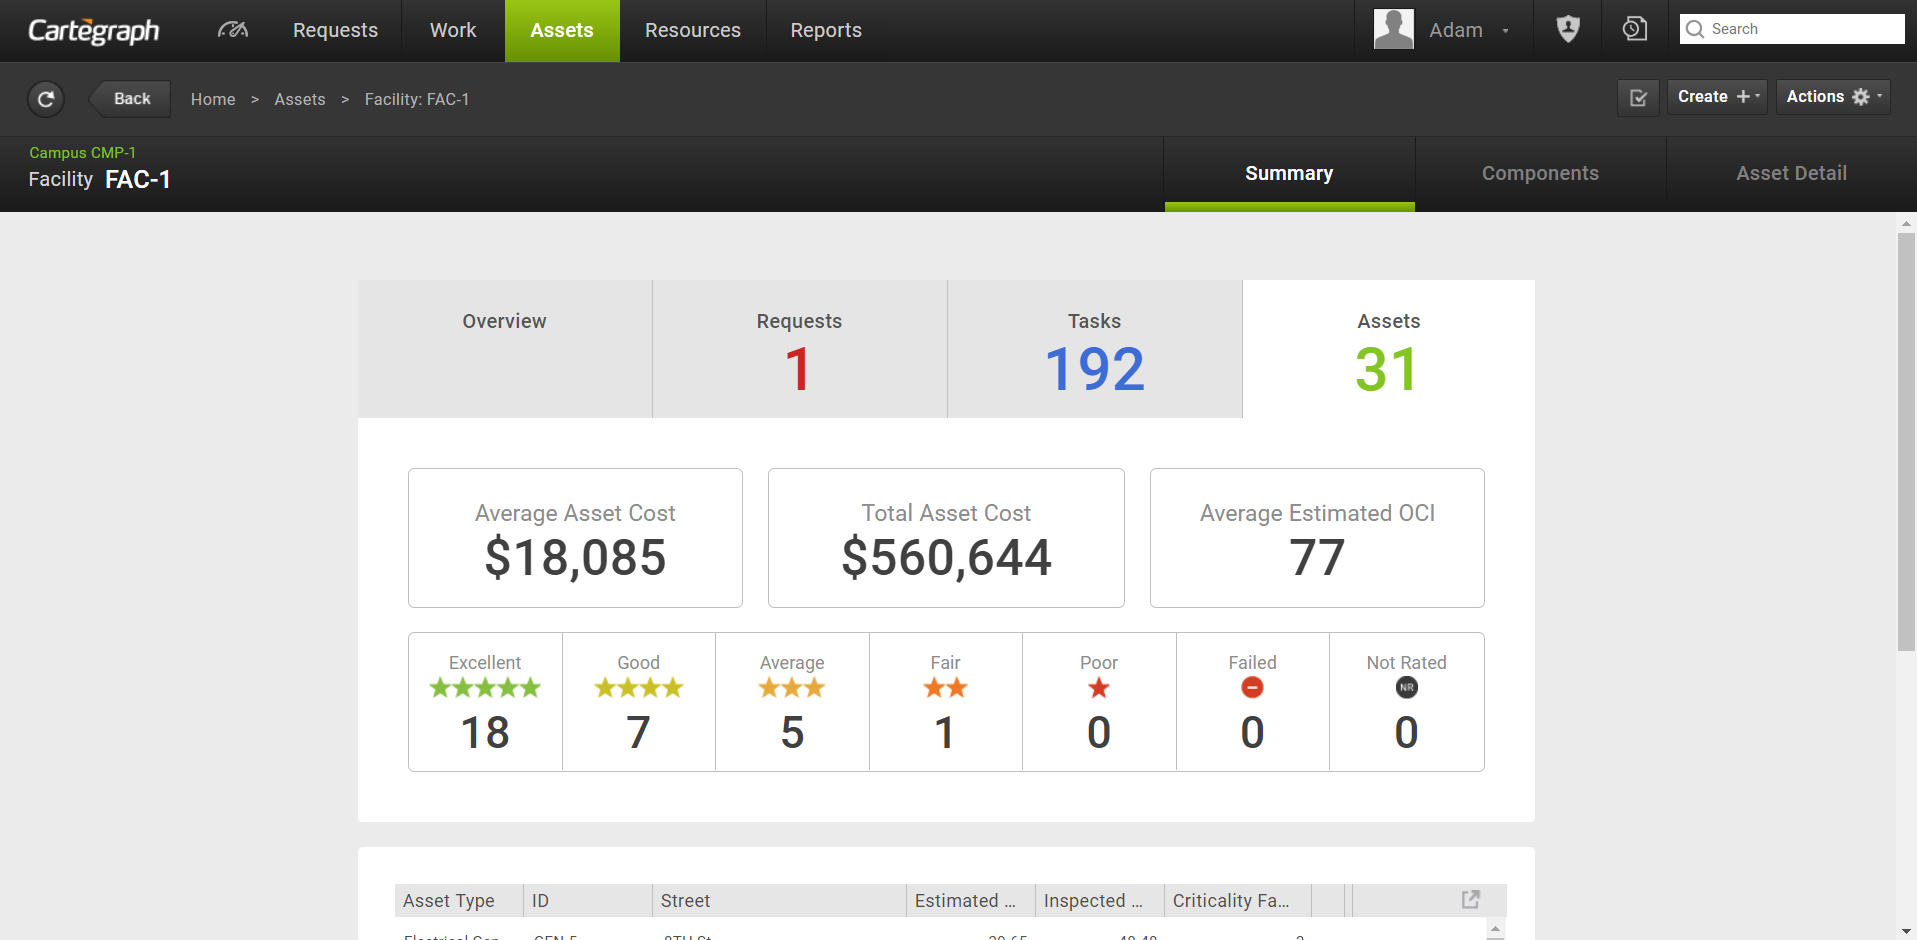
- Total asset count of the container and its components displays in the Assets tab header. If a component asset is disconnected from the container, it is no longer reflected in the Assets count, whether or not it has tasks still included in the container Task list. To see the Component asset list, go to the Components tab for the Container asset.
- Average asset cost is the total asset cost divided by total asset count.
- Total asset cost is the cost of all currently connected assets regardless of when the asset costs were incurred. This may be different than the total container cost on the Overview tab. Costs for assets removed from the container are no longer included in this value.
- Average Estimated OCI is the sum of all Estimated OCI values divided by total assets. If an asset does not have a estimated OCI rating, it is not counted.
- Asset count for each asset condition rating.
- Asset count for assets not inspected.
- List of Assets in the container. The List view count matches the asset count in the Assets tab header. By default, the list displays the same columns as on the Assets index list view. Changes made to columns selected, column size, or sorts persist to the Asset’s List view.
Components Tab
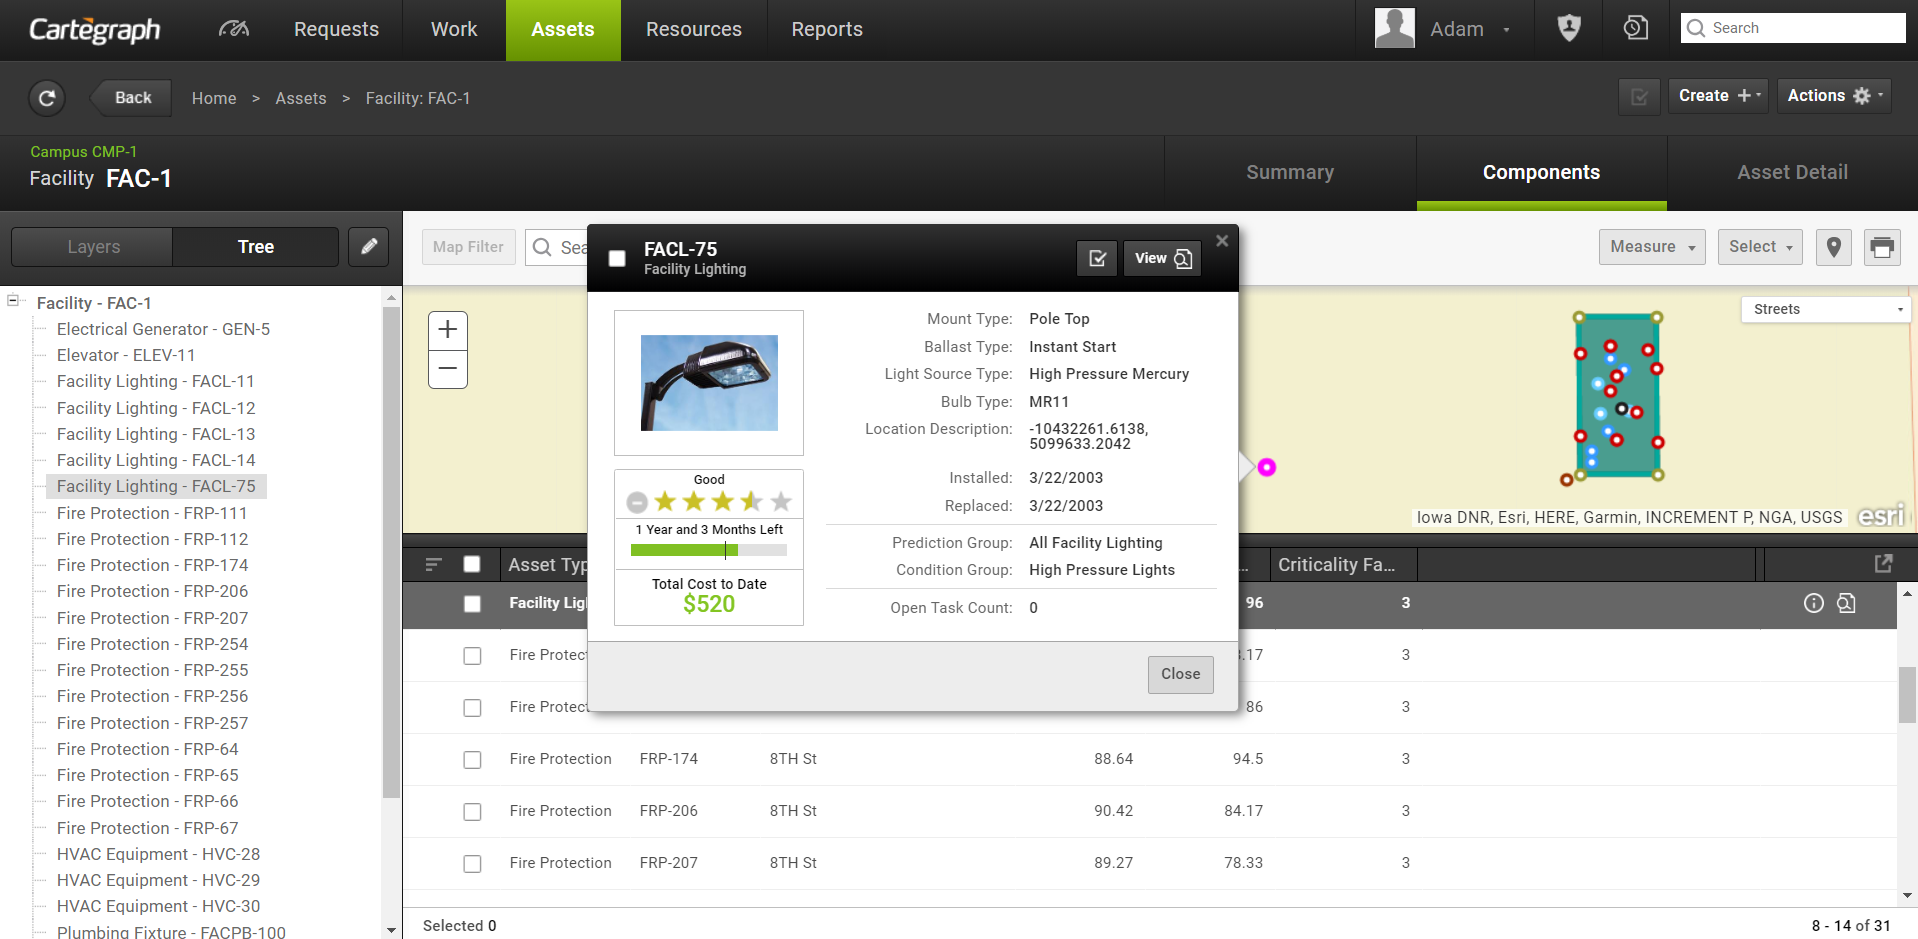
The Components tab includes the Layers and Tree tab seen in the left side of the above image:
- The Layers tab displays all the component assets, their asset count, and layer color.
- The Tree tab displays a tree view of all the components in a hierarchy format.
Asset Detail Tab
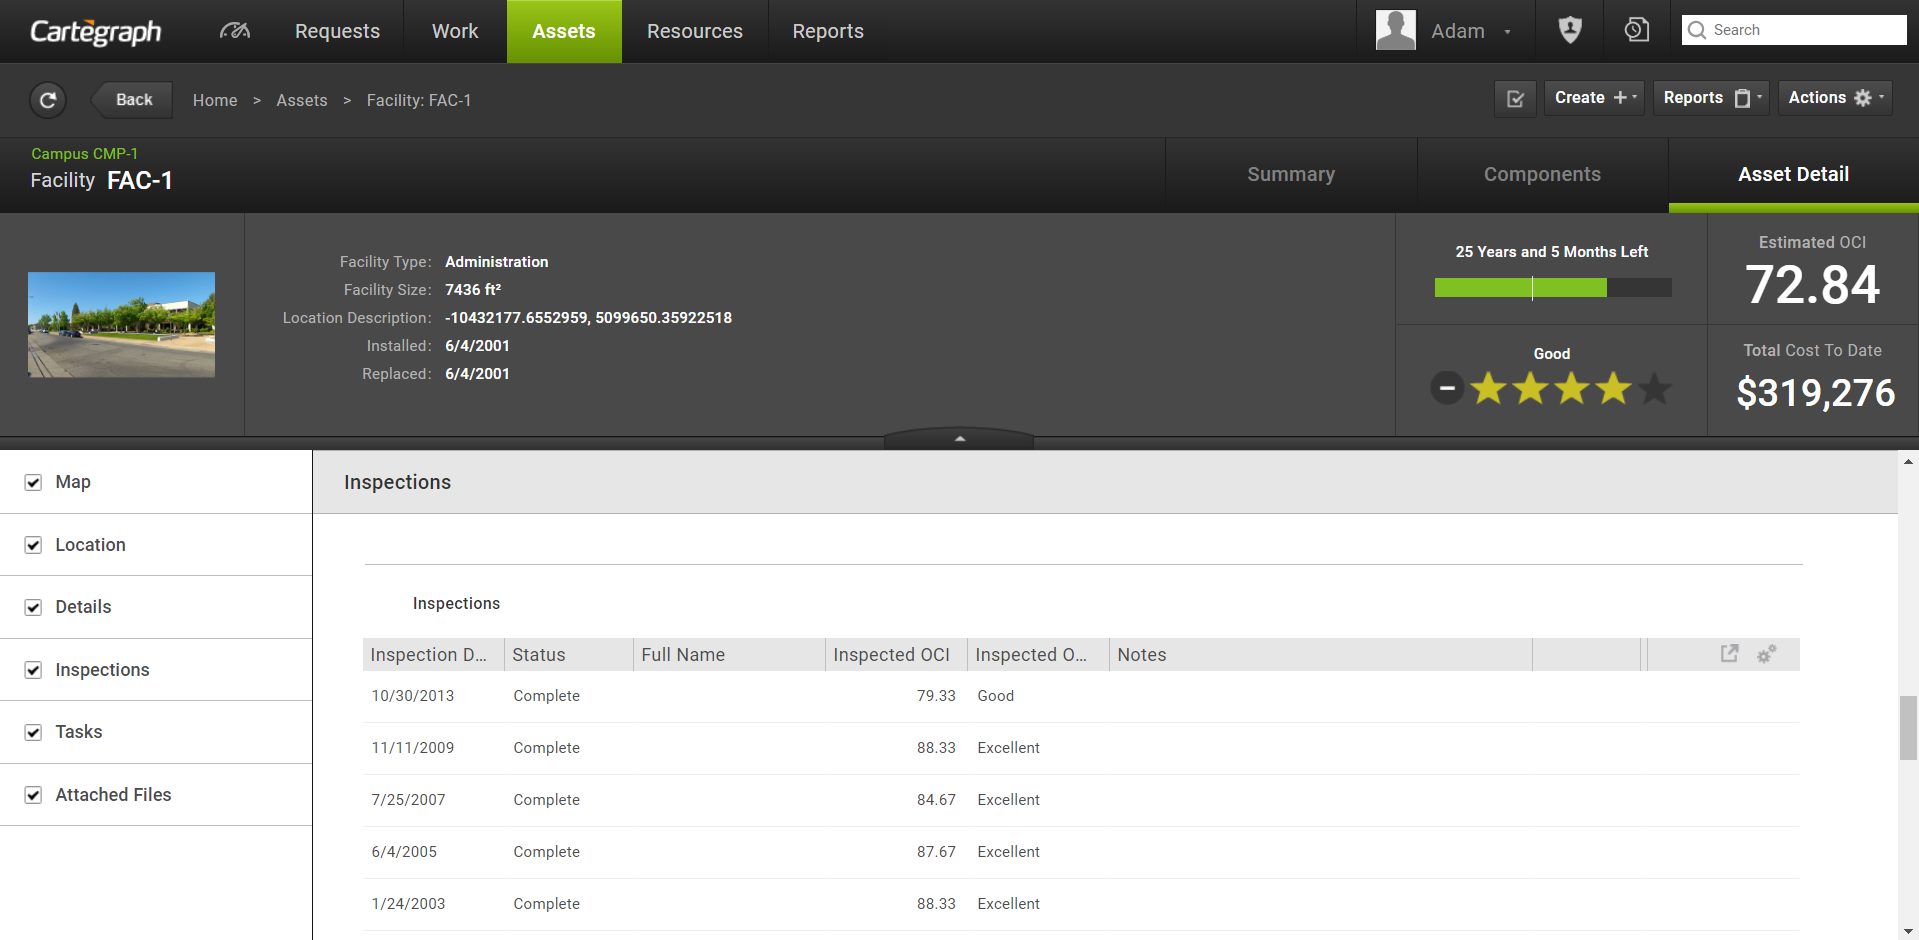
The Asset Detail tab displays the same information for all Assets in the Detail view. For example, location information, relevant dates, OCI, and total cost.
Condition Manager
Asset Condition Manager allows users to create, update, delete, duplicate, and maintain Prediction Groups, Condition Groups, and Condition Categories.
Condition Categories
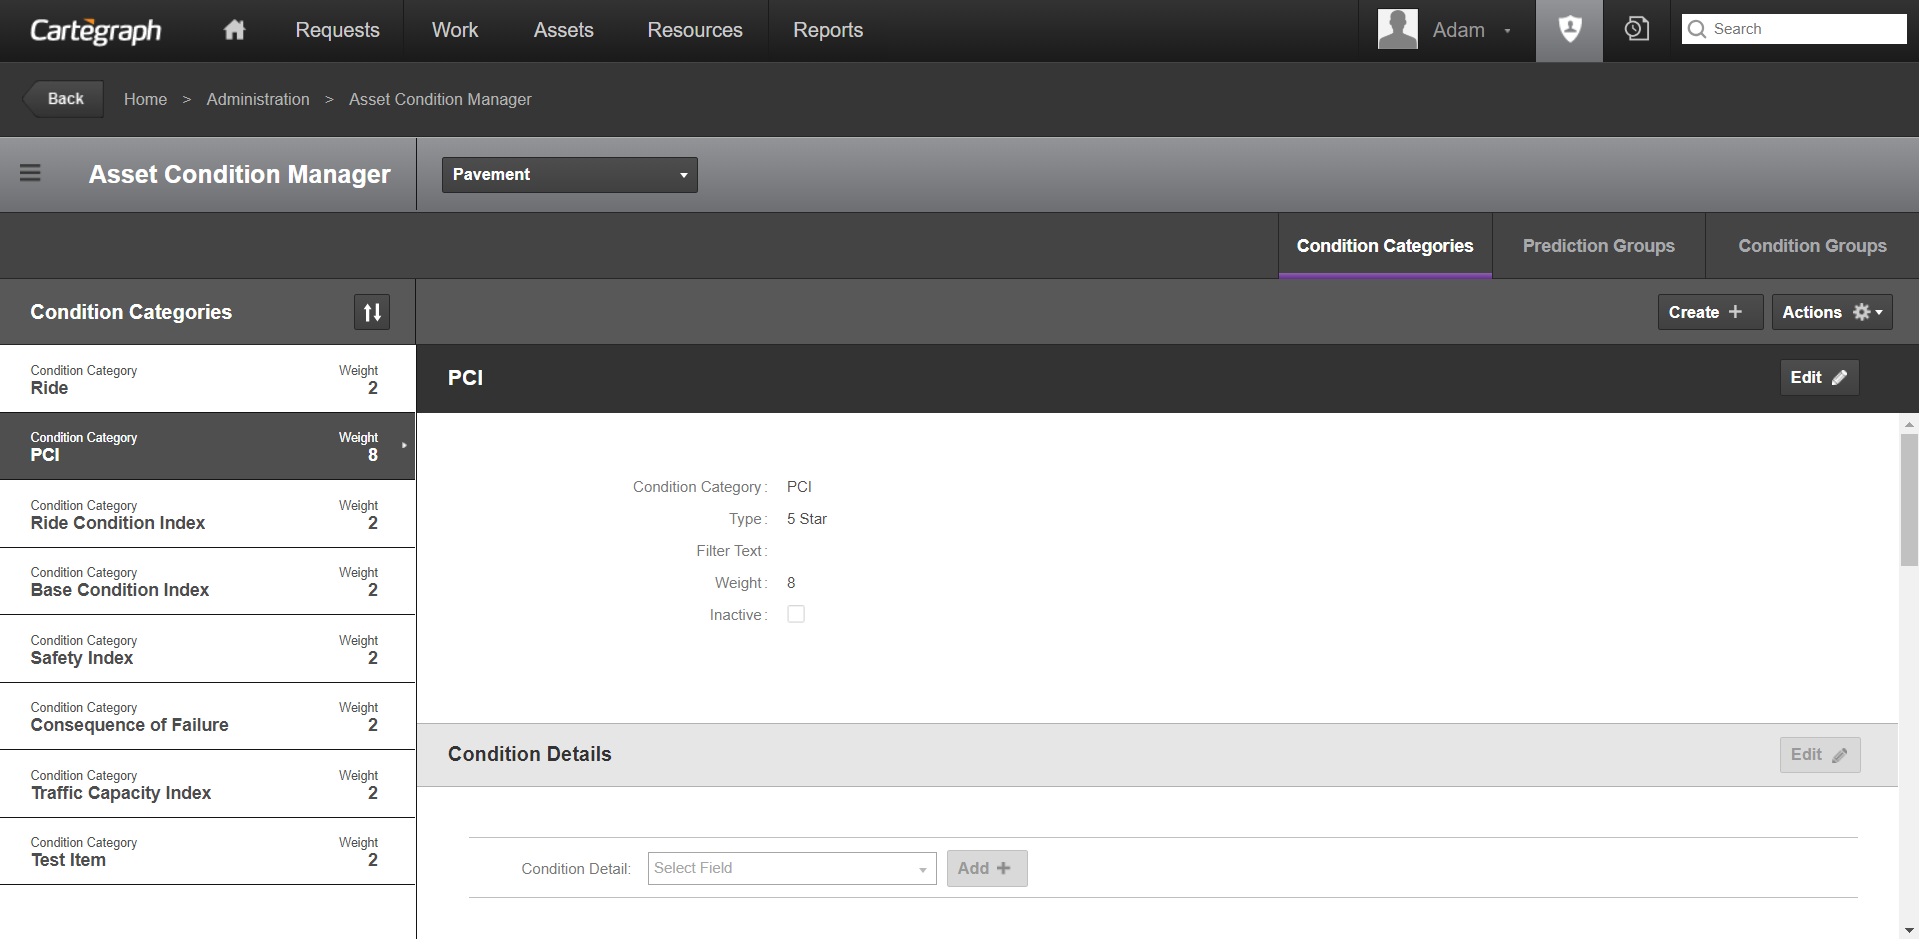
Condition categories are characteristics observed during inspections and can be used to estimate asset deterioration. The weight indicates the impact of a condition category on the asset’s Overall Condition Index (OCI).
- Create Condition Categories if your organization inspects for characteristics not found in the start up data.
- Change Condition Category weights if your organization places more or less emphasis on a particular condition when assessing OCI.
- The Legend Ra and Background Ra Condition Categories for Signs as well as the PCI Condition Category for Pavement and Pavement Area cannot be deleted.
- The filter text lets you filter the assets the Condition Category applies to at a finer level. You cannot enter anything in the Filter Text field. This field displays the results of the advanced filter you create. For example, the Pavement Condition Category, Safety, should only apply to pavement records with four or more lanes. Click and create the filter “Number of lanes is greater than 3” for this Condition Category.
- Impacts is a child recordset available for condition categories for Sign Assets.
- Index Mappings is a read-only child recordset to condition categories.
- Examples of condition categories that come with start up data are Aesthetics, Surface and Structure.
You must have an advanced feature extension for these additional benefits:
- The Type determines how the condition category will be measured during an inspection.
- Each Condition Category must have a performance curve, to accurately calculate an asset’s remaining life.
- If you do not collect Sign Ra readings, do not set performance curves for Legend Ra and Background Ra Condition Categories.
- Impacts and Index Mappings are child recordsets available to all condition categories.
- Impacts and Index Mappings are edited in Asset Condition Manager.
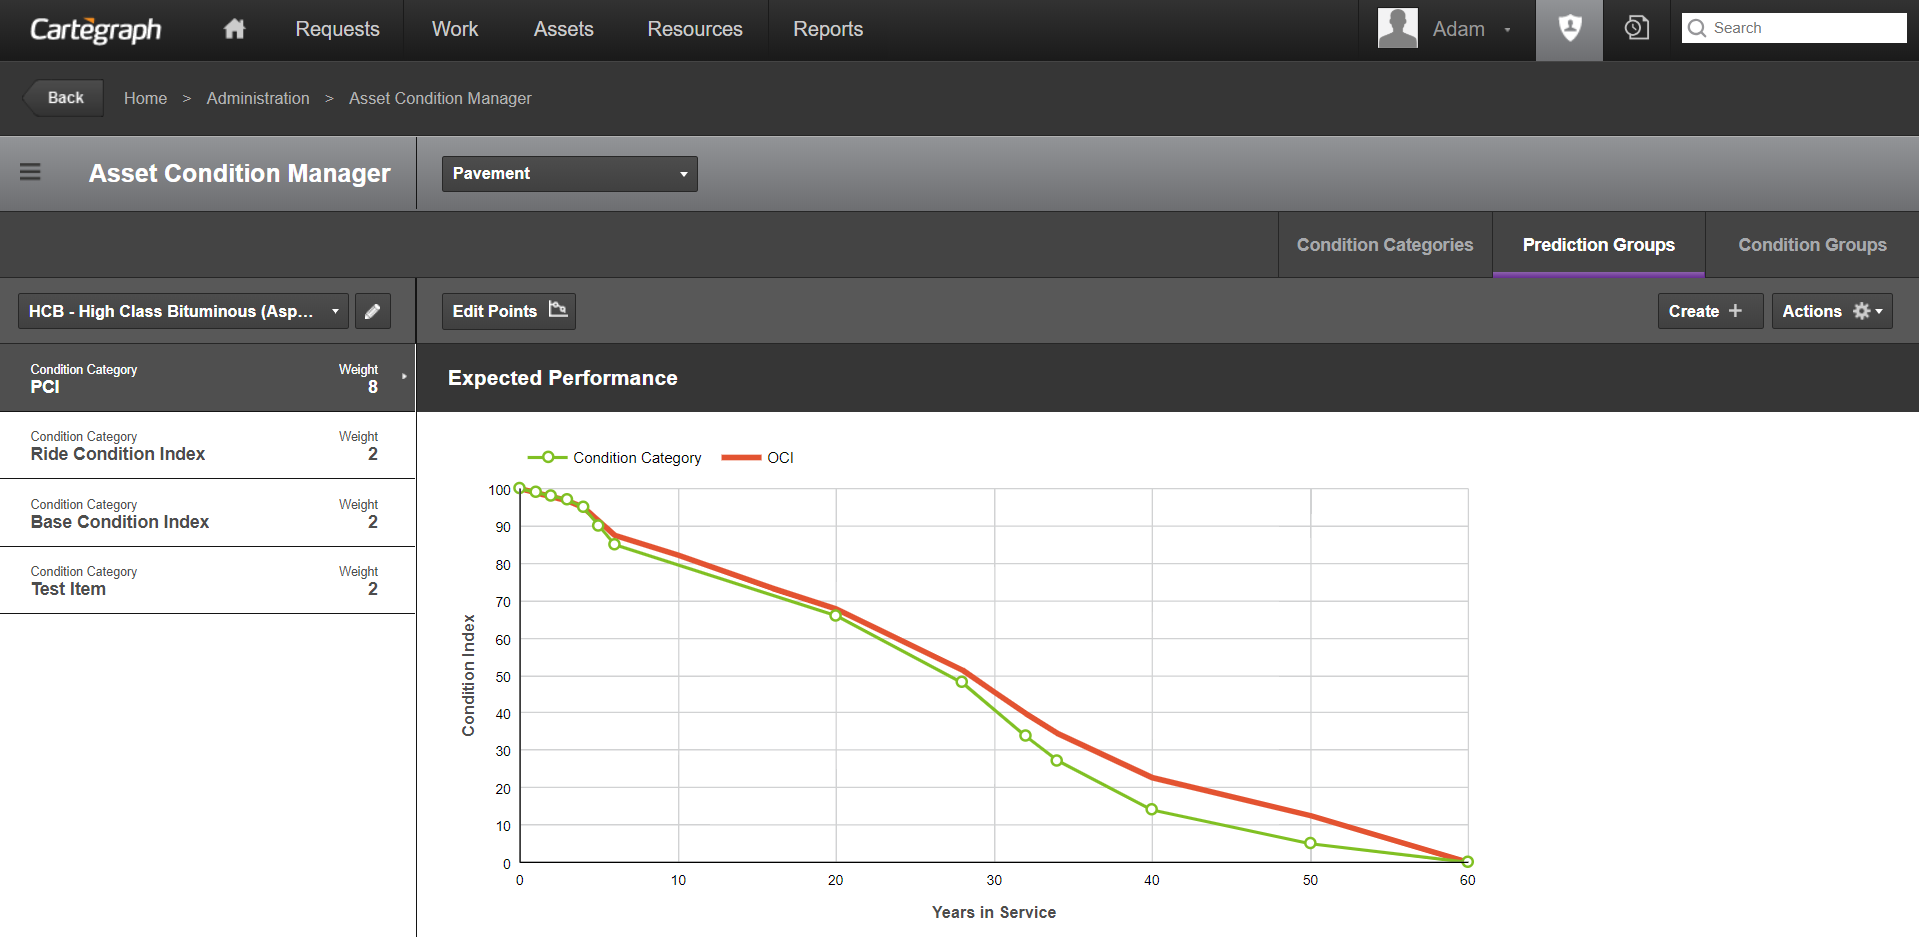
Prediction Groups
You must have administrator rights to access this feature.
- Prediction Groups allows a user to maintain asset performance curves.
- Performance curves track asset deterioration for individual condition categories over time.
- The deterioration data is stored in prediction groups. You assign an asset to a prediction group based on the filter.
- The filter text lets you define the group of assets a Prediction Group applies to. You cannot enter anything in the Filter Text field. This field displays the results of the advanced filter you create. For example, pipes made of the same type of material, such as concrete, deteriorate at a similar rate. Create a Water Main prediction group named Concrete Mains. Click Filter and create the filter “Material is equal to Concrete”.
- The performance curve is graphed using Years in Service (the asset’s age) and Condition Index (the asset’s condition value).
- The performance curves reflect the anticipated deterioration of each Condition Category, and as a result of the Overall Condition Index, if no maintenance is done to that asset. The weights assigned to each Condition Category help determine the OCI curve. Year values should begin at 0 and end at the asset’s anticipated expiration age. Index values typically begin at 100 and always end at 0. Each curve must have at least two points.
- When you set up performance curves, each condition category curve is combined, through a weighted average, to generate the Overall Condition Index (OCI) curve. The points of the OCI curve cannot be directly accessed or edited. The OCI curve is automatically updated based on edits to the condition category curves.
- You can click on the performance curve’s Legend to hide and show the corresponding curve:
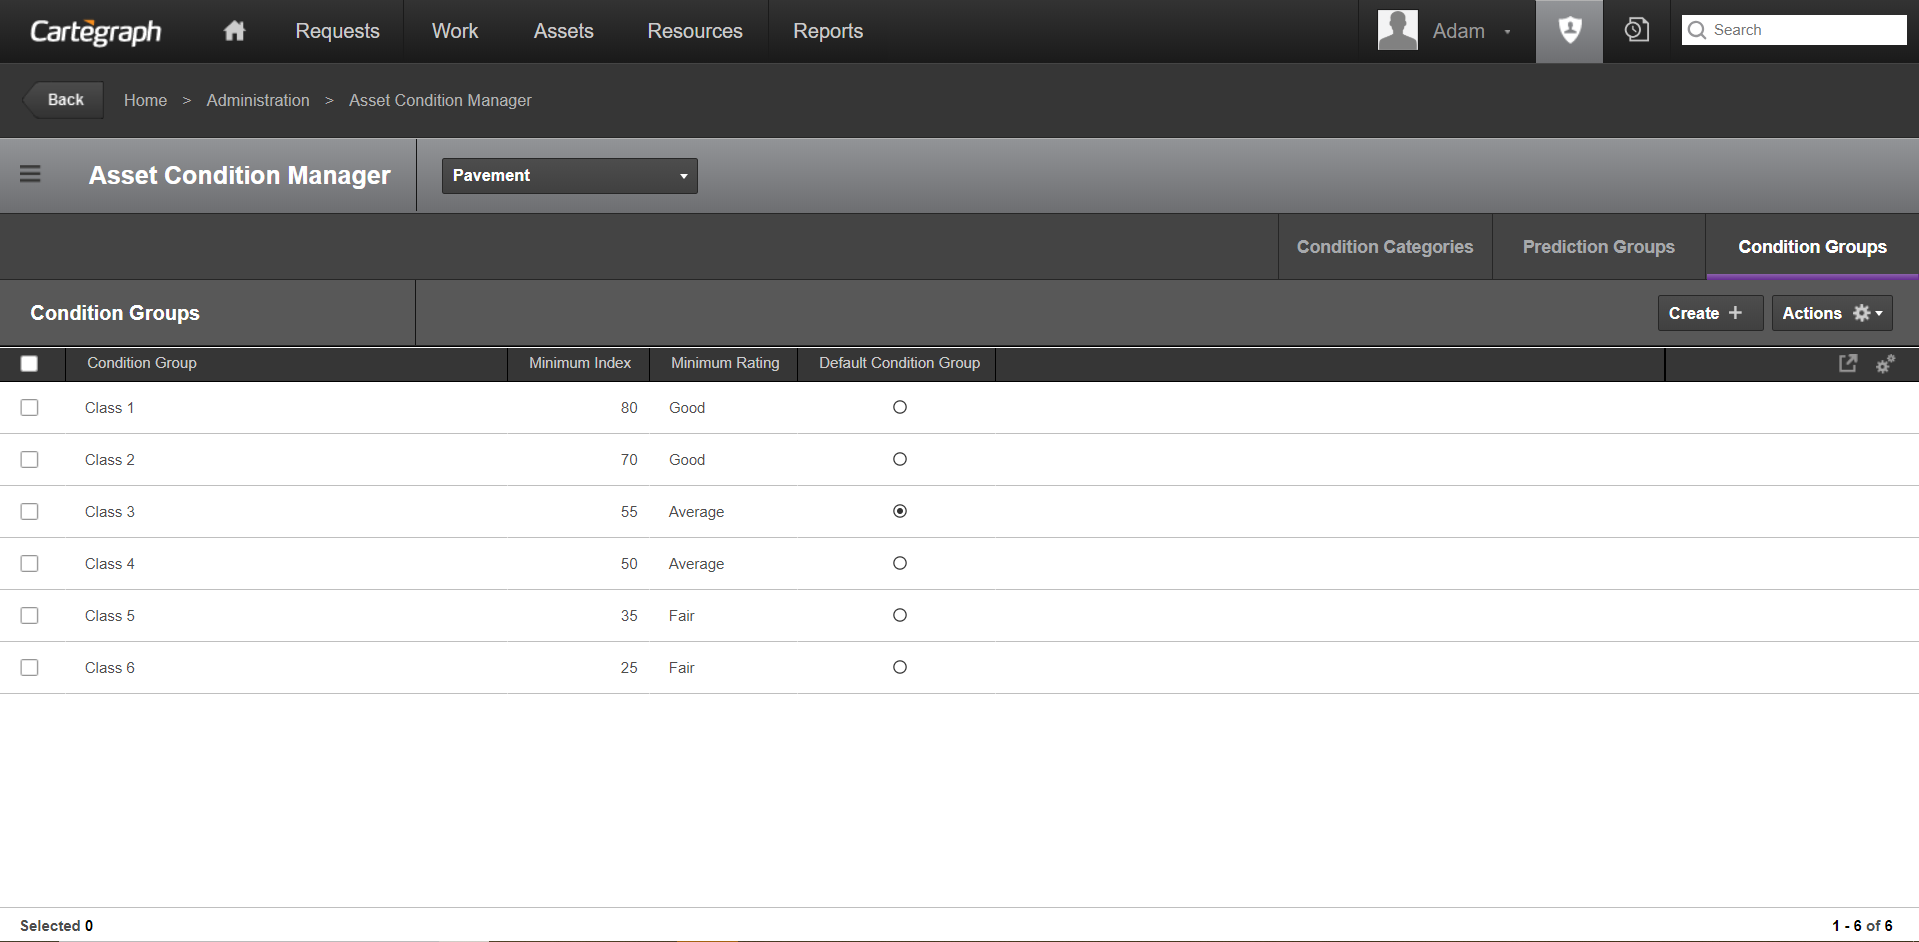
Condition Groups
This functionality is found in the OpenGov EAM tab: Administration>Asset Condition Manager.
- A Condition Group establishes the point an asset is considered below the minimum acceptable condition or failure point. Assign an asset to a condition group based on the filter.
- When an asset reaches its minimum condition, it is considered to have no remaining life. The Act Before field displays the date an asset’s OCI goes below the minimum index as defined by the asset’s assigned Condition Group.
- The Minimum Index is the lowest point at which the condition is deemed acceptable. If the index calculation results in a value lower than this, the condition is unacceptable.
- Minimum Rating identifies the rating of the minimum index.
- The filter text lets you define the group of assets a Condition Group applies to. You cannot enter anything in the Filter Text field. This field displays the results of the advanced filter you create. For example, roadways with the same functional classification may have the same minimum acceptable condition. Create a Pavement condition group named Rural Arterial. Click Filter and create the filter Functional Classification is equal to Rural Arterial.
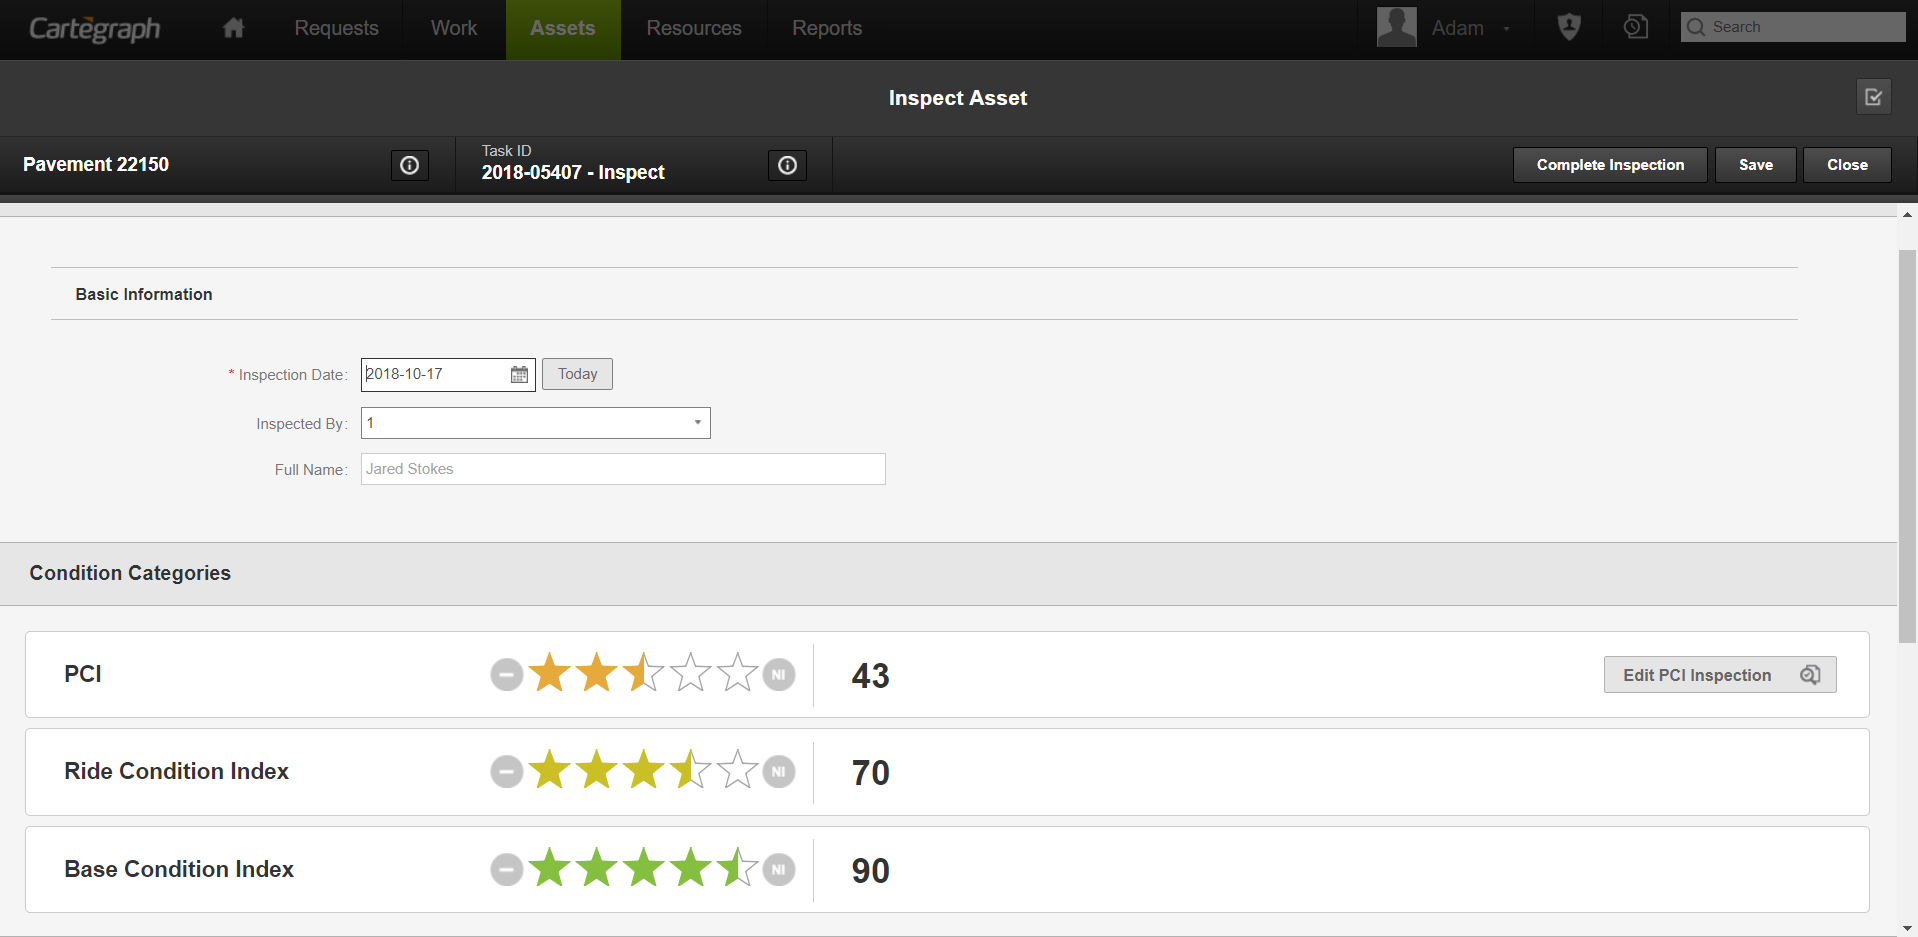
Condition Category Measured Value
Measured Value is a field on the Condition Category recordset under an asset’s Inspection recordset. It represents the inspected value for each condition category. When a star is selected during an inspection, the system looks at the index mappings for that condition category to determine the Index for that inspected condition category. The measured value is the number of stars (0-5) that represents the condition of the asset for that condition category.
With the Advanced Assets Extension, when a measured value is selected/entered during an inspection, the system looks at the index mappings for that condition category to determine the Index for that inspected condition category.
The value of the Measured Value field depends on the condition category type:
5 Star
- The measured value is the number of stars (0-5) that represents the condition of the asset for that condition category.
Index
- The measured value is the number entered (0-100) that represents the condition of the asset for that condition category.
- There are no index mappings for this Type, so the measured value sets the Index with the same number.
Number
- The measured value can be any positive or negative number that falls within the bounds of the Index Mappings for the condition category.
- If the number is not specifically mapped in the Index Mappings but falls within the bounds, the system uses the existing index mappings and interpolates an Index.
Quantity
- The measured value can be any positive or negative amount including a unit, that falls within the bounds of the Index Mappings for the condition category.
- The unit can be the default or a convertible unit. If a convertible unit is selected, the system converts it to the default unit to determine the Index based on the Index Mappings, however the selected unit is saved on the Inspection.
- If the number is not specifically mapped in the Index Mappings but falls within the bounds, the system uses the existing index mappings and interpolates an Index.
- An example of a Quantity type condition category where the Unit Category is Temperature and the Default Unit is C for Celsius, but the inspection is recorded in Fahrenheit:
- All Index Mappings are created as Celsius.
- During the inspection, the measured value is set to 77 F. The system converts this measured value to 25 C to determine the inspected Index based on the Index Mappings.
Option
- The measured value can only be one of the Index Mapping values.
If there are no Index Mappings for a Condition Category that requires them, a warning indicator displays in edit mode of the Inspection.
Overall Condition Index (OCI)
Condition inspections calculate the Overall Condition Index (OCI) for an asset. OCI is calculated for the date of the inspection. The minimum condition is used to calculate the asset’s failure point. Inspections should have data for every condition category with weights, impacts, and a performance curve.
There are two types of OCI calculations, Inspection and Estimated:
Inspection OCI Calculations
Inspections calculate the Inspection OCI. The Inspection OCI is calculated for the date of the inspection. The inspection OCI is a weighted average of the inspection’s condition category indexes. Inspections should have data for every condition category with weights.
Inspections provide a procedure to better manage your organization’s assets and equipment by planning and predicting.
- The Inspected Overall Condition Index (OCI) calculate only after an inspection’s status is Complete.
- Each asset has an Inspections child recordsets for capturing more inspection details.
- Condition Categories list the asset’s attributes or criteria being inspected. For example, a picnic table’s Structure and Surface are Condition Categories.
- Additional Inspection details can be recorded if structure is added to the Inspection recordset. For example, Observations.
- The Condition Category library contains the criteria, weight, and the index mappings to calculate the Inspection OCI, which is used to set the Inspection OCR based on the asset’s Overall Ratings library.
- Each inspection record contains a hidden, automatically generated ID in the Current ID field. This ID also displays parent level to the Asset and is called Current Inspection ID. The most recent inspection’s ID is used as the asset’s Current Inspection ID.
When a Condition Category is marked Not Inspected (NI):
- If it has a performance curve, the NI icon displays and the index for the condition category is calculated using the performance curve for that condition category.
- If it does not have a performance curve, the NI icon displays and a warning message displays that the index cannot be estimated, and the Condition Category is not included in the weighted estimate of the inspected OCI.
With the Advanced Asset Extension:
- Inspections also help to determine the performance or OCI of any asset over its life cycle. The inspection data entered is used to calculate the Estimated OCI of the asset.
- The inspection index of each condition category is incorporated into the asset’s performance curve, which estimates the deterioration of the asset. Completed tasks with an identified impact also affect the asset’s performance curve.
Estimated OCI Calculations
The estimated OCI for an asset is calculated by taking into account the asset’s age, predicted performance, and inspections and tasks performed on the asset. Using this data, the estimated OCI for the asset is determined.
Assets should have an installed or replaced date, fall into a condition group and prediction group as well as have data for every condition category with weights, impacts, and a performance curve.
This functionality automatically begins whenever an asset’s condition needs to be updated. For example, when a task or inspection is saved. The calculations also update when the Cartegraph Asset Condition Recalculator runs.
The values in the following fields are recalculated:
- Prediction Group
- Condition Group
- Act Before
- Estimated OCI
- Estimated OCR
- All the data in the Performance Curve on the asset record
A Condition Group is selected based on the Condition Group filters. A Prediction Group is selected based on the Prediction Group filters. If a Prediction or Condition Group cannot be found for the asset, no calculations are performed.
An asset’s Performance Curve is shifted based on completed inspections and tasks. The age of the asset as of today is plotted on the adjusted curve to determine today’s estimated condition. These results are stored in the Estimated OCI (Overall Condition Index) field. The point where the adjusted curve falls below the minimum index for the asset’s condition group is stored in the Act Before field.
Inspections
An inspection is initiated by assigning an Inspection Activity to an asset management task. Inspections can be applied to any Asset Type, including equipment assets, that has been setup in the system. Inspections provide a procedure to better manage your organization’s assets and equipment by planning and predicting.
- The Inspected Overall Condition Index (OCI) calculate only after an inspection’s status is Complete.
- Each asset has an Inspections child recordsets for capturing more inspection details.
- Condition Categories list the asset’s attributes or criteria being inspected. For example, a picnic table’s Structure and Surface are Condition Categories.
- Additional Inspection details can be recorded if structure is added to the Inspection recordset. For example, Observations.
- The Condition Category library contains the criteria, weight, and the index mappings to calculate the Inspection OCI, which is used to set the Inspection OCR based on the asset’s Overall Ratings library.
- Each inspection record contains a hidden, automatically generated ID in the Current ID field. This ID also displays parent level to the Asset and is called Current Inspection ID. The most recent inspection’s ID is used as the asset’s Current Inspection ID.
When a Condition Category is marked Not Inspected (NI):
- If it has a performance curve, the NI icon displays and the index for the condition category is calculated using the performance curve for that condition category.
- If it does not have a performance curve, the NI icon displays and a warning message displays that the index cannot be estimated, and the Condition Category is not included in the weighted estimate of the inspected OCI.
With the Advanced Asset Extension:
- Inspections also help to determine the performance or OCI of any asset over its life cycle. The inspection data entered is used to calculate the Estimated OCI of the asset.
- The inspection index of each condition category is incorporated into the asset’s performance curve, which estimates the deterioration of the asset. Completed tasks with an identified impact also affect the asset’s performance curve.
Pavement Condition Index (PCI) Inspections
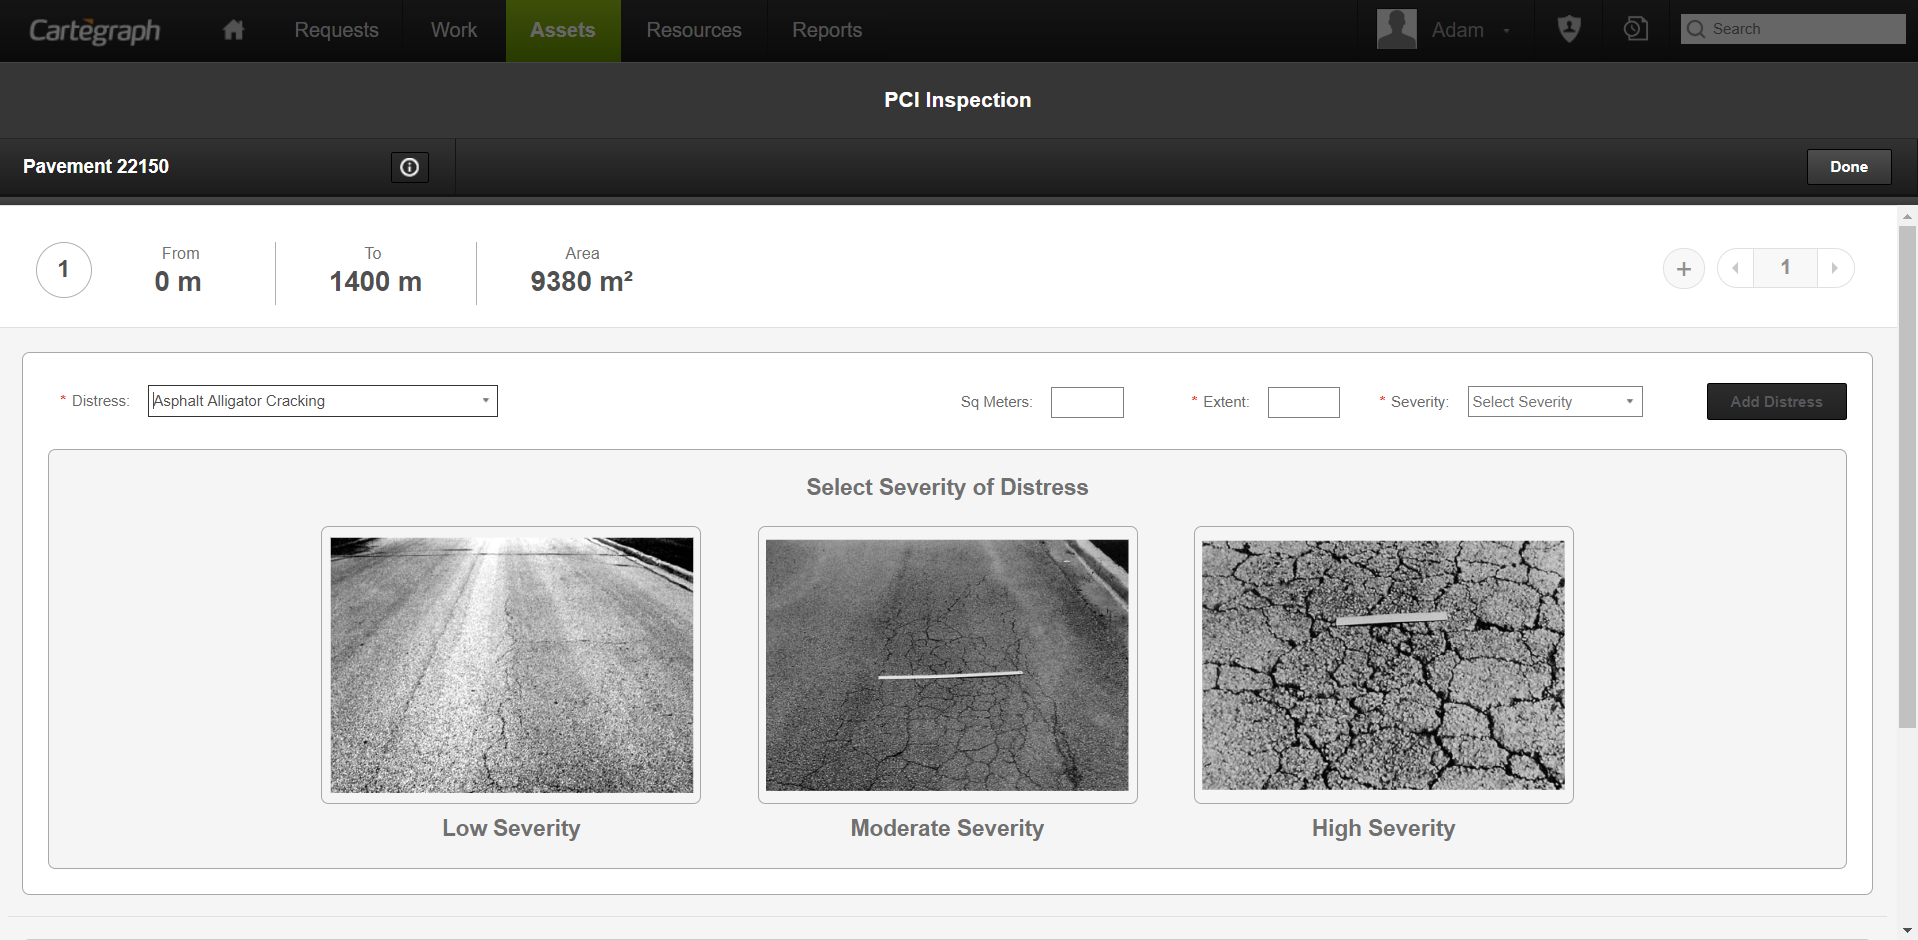
The Pavement Condition Index (PCI) is a numerical indicator that rates the surface condition of the pavement. The PCI provides a measure of the present condition of the pavement based on the distress observed on the surface of the pavement, which also indicates the structural integrity and surface operational condition. It provides an objective and rational basis for determining maintenance and repair needs and priorities. Continuous monitoring of the PCI is used to establish the rate of pavement deterioration, which permits early identification of major rehabilitation needs. The PCI provides feedback on pavement performance for validation or improvement of current pavement design and maintenance procedures.
Remaining Life
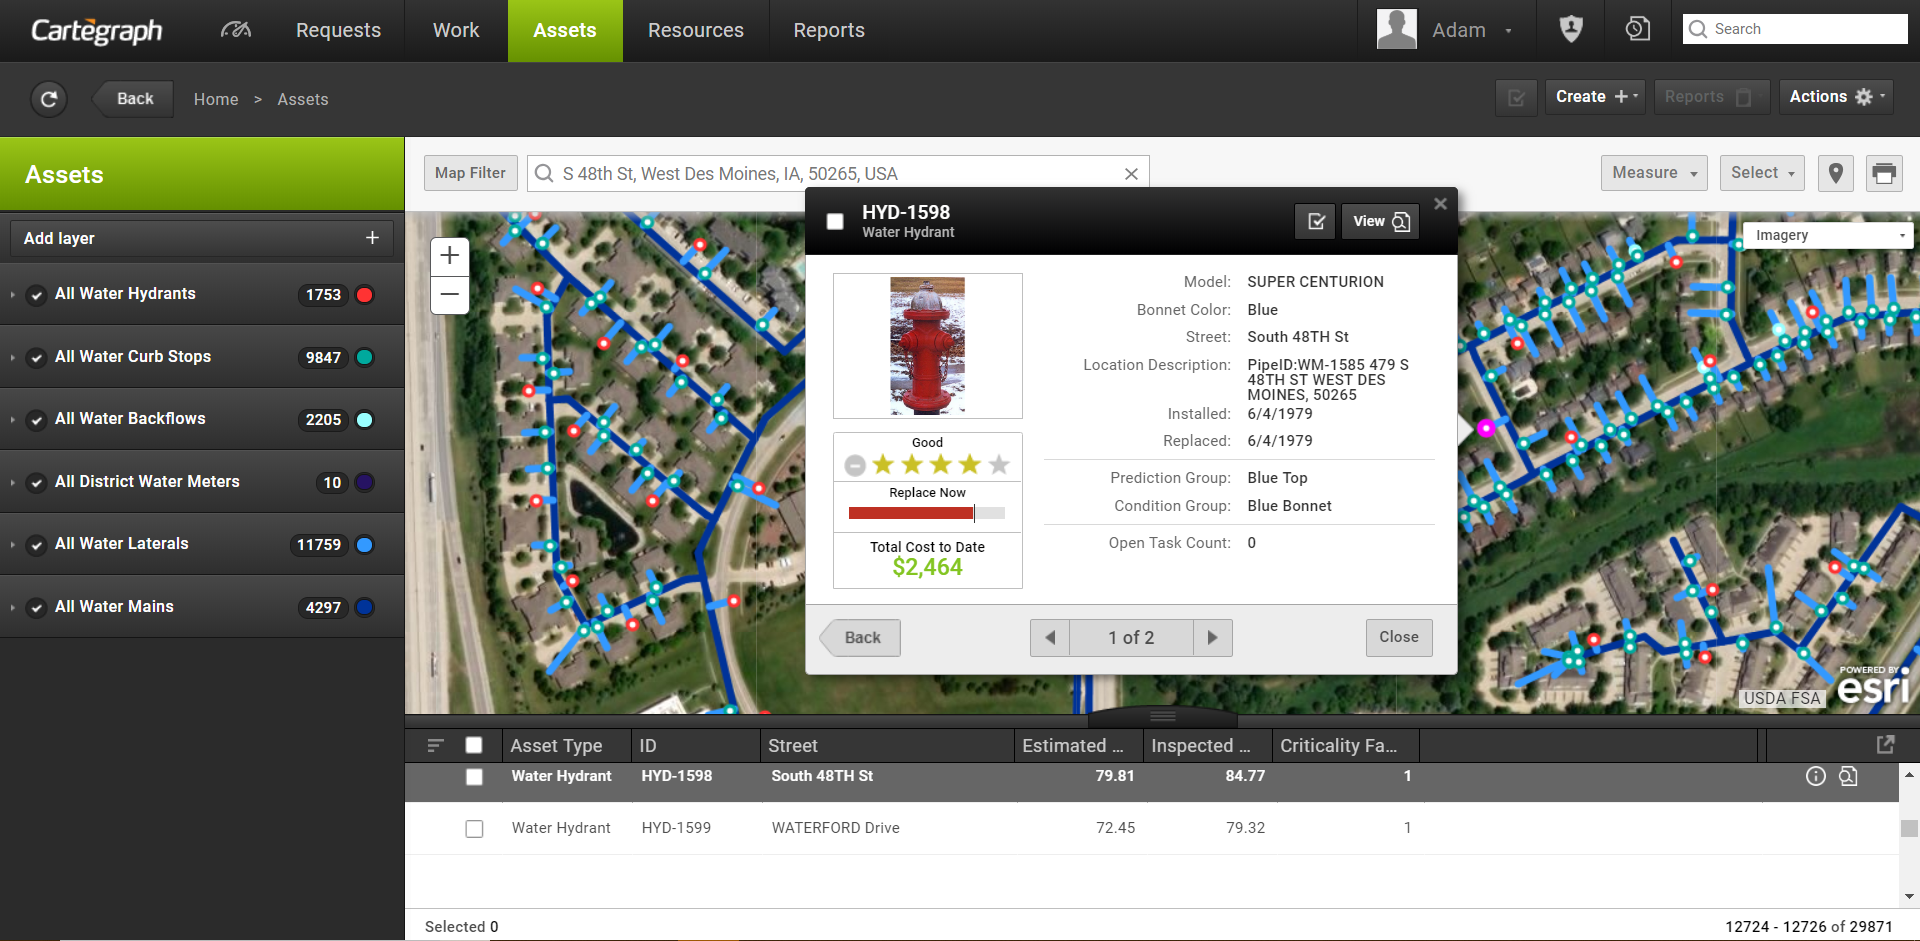
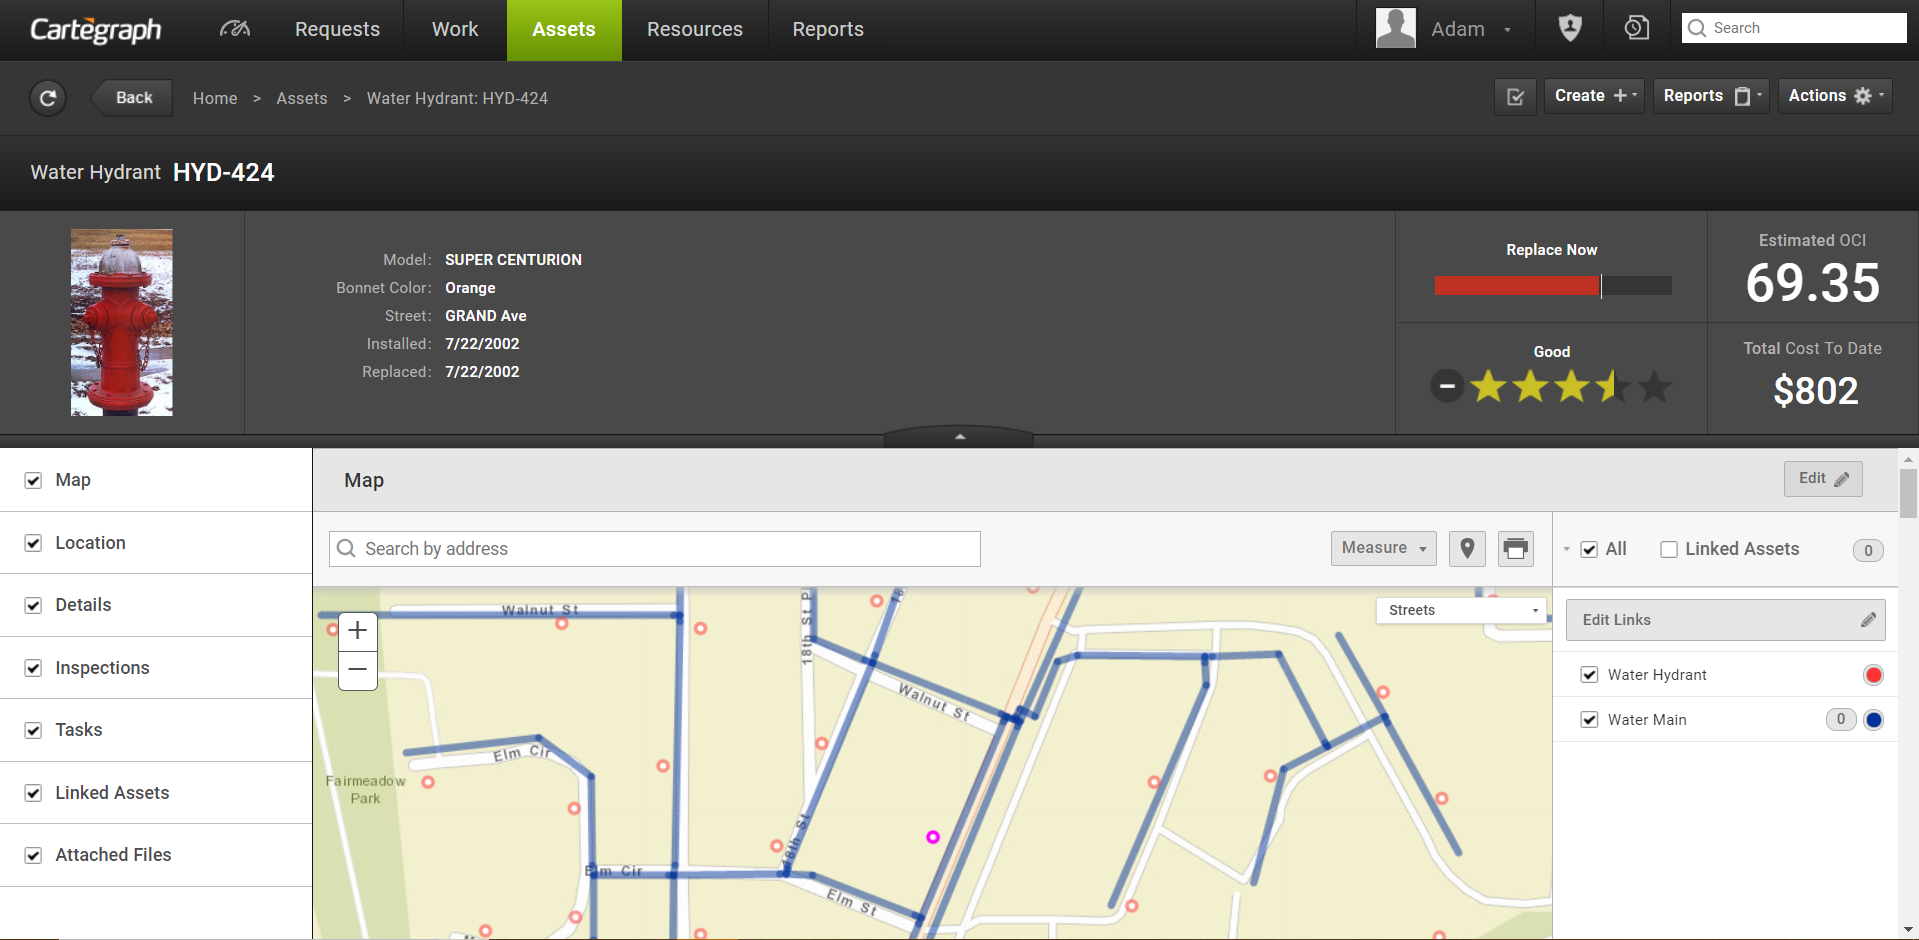
Remaining life is the amount of time it takes for an asset to reach its established minimum condition value based on the asset’s individual performance curve and assigned condition group. The date on which an asset is expected to reach its minimum condition is available in the Act Before field. For remaining life to calculate, the asset must have a condition group, prediction group, and installed or replaced date.
In , the remaining life displays on:
- Asset summary tool tip
- Asset Detail view’s Overview header
- Tasks associated to assets on the Summary tool tip’s Asset Detail tab.
- Progress Bar
- The progress bar is the index range of 0-100 index.
- The marker represents the asset’s minimum condition.
- The bar indicates the Estimated OCI.
![]() If the Estimated OCI is greater than the minimum condition, the bar is green. The estimated amount of remaining life is also displayed.
If the Estimated OCI is greater than the minimum condition, the bar is green. The estimated amount of remaining life is also displayed.
![]() If the Estimated OCI is less than or equal to the minimum condition, the bar is red. If the current date is on or after the Act Before date, Replace Now displays instead of the remaining life.
If the Estimated OCI is less than or equal to the minimum condition, the bar is red. If the current date is on or after the Act Before date, Replace Now displays instead of the remaining life.
![]() If the asset does not have a minimum condition as defined by its Condition Group, the remaining life cannot be calculated, and Data Not Available displays. The progress bar displays the Estimated OCI if it can be calculated on a 0-100 scale.
If the asset does not have a minimum condition as defined by its Condition Group, the remaining life cannot be calculated, and Data Not Available displays. The progress bar displays the Estimated OCI if it can be calculated on a 0-100 scale.
If the Estimated OCI cannot be calculated, the bar is empty and Data Not Available displays.
Criticality Factor/ Levels of Service
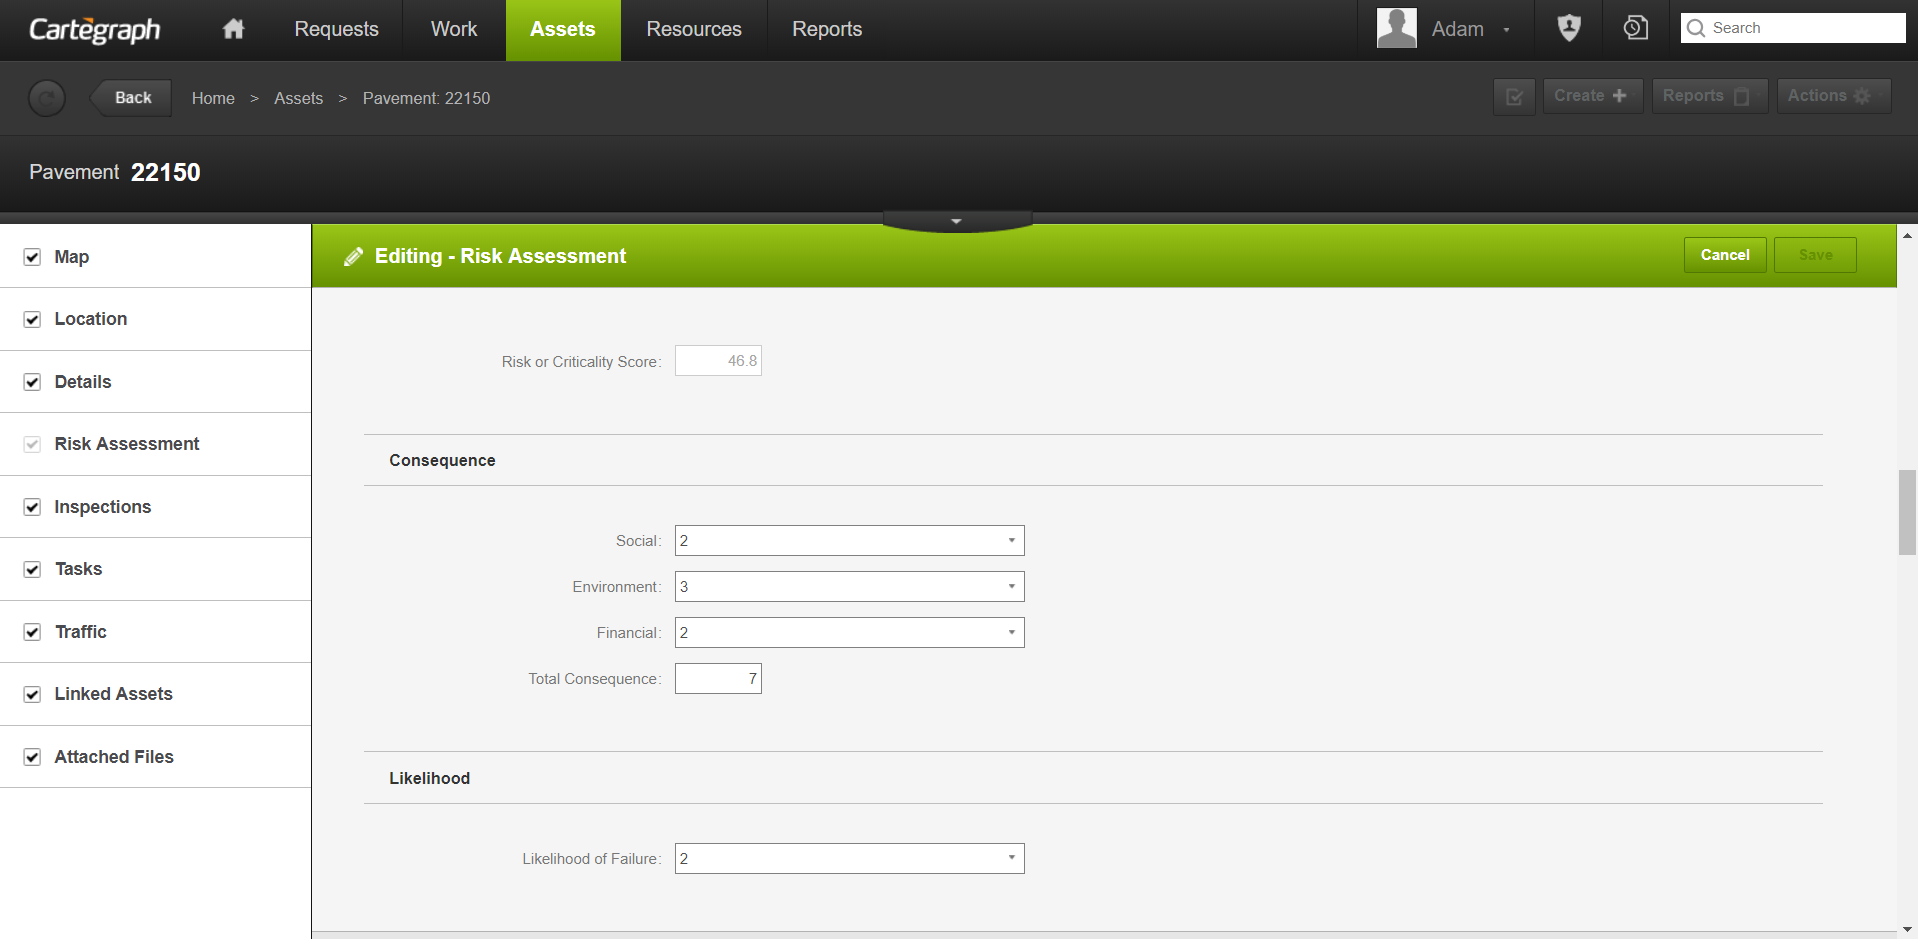
You must have administrator rights to access this feature.
Criticality Factor is a numeric representation of asset ranking based on a subjective, user-defined ordering that identifies the relative importance of a particular asset. A higher number means a higher priority.
The default value is 1 and values cannot be negative. The field exists for all asset types including Equipment and any assets created using Cartegraph’s Asset Builder functionality.
An asset’s Criticality Factor can be viewed from the asset grid on the Asset page. The field also displays on the cross-asset list.
Options for updating Criticality Factor include:
- Mapping it as a field in GIS Integration to have it populated from the Esri system
- Adding it to the asset’s Detail View and directly editing the value
- Importing values
Understanding an asset’s importance as compared to other assets is valuable when analyzing data and making decisions. Asset Criticality can be utilized by Scenario Builder to prioritize work tasks.
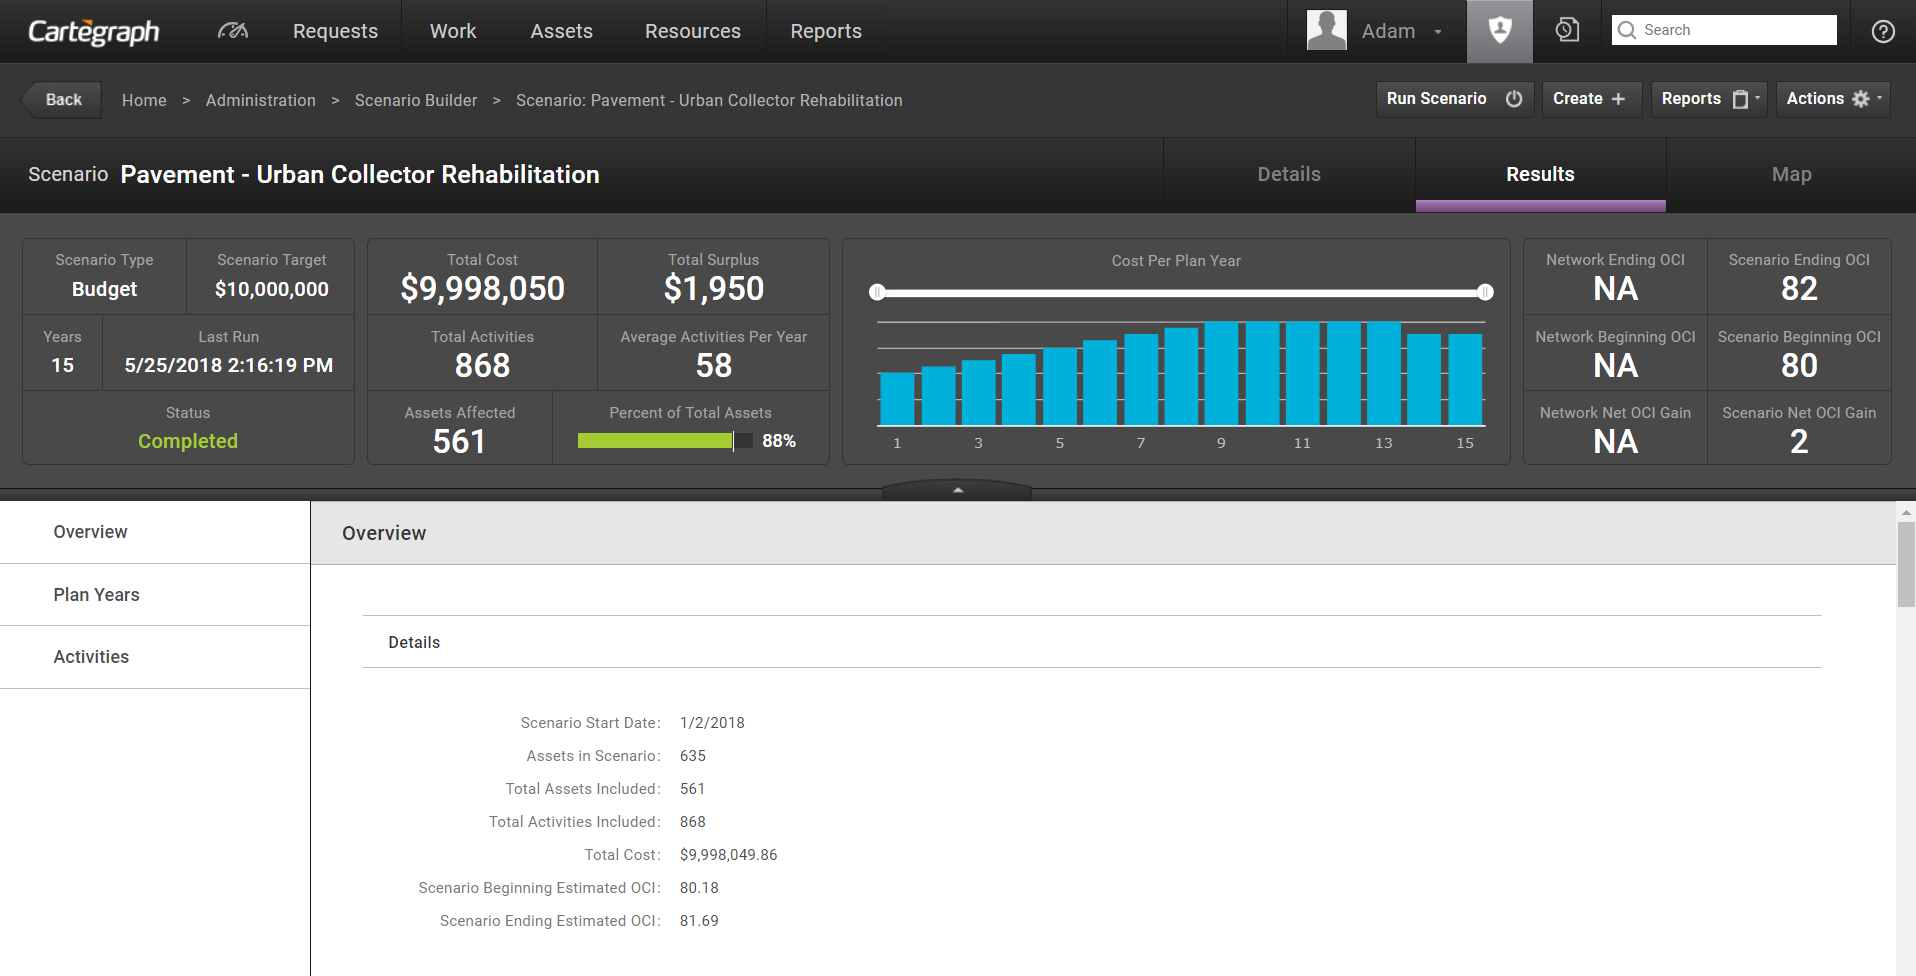
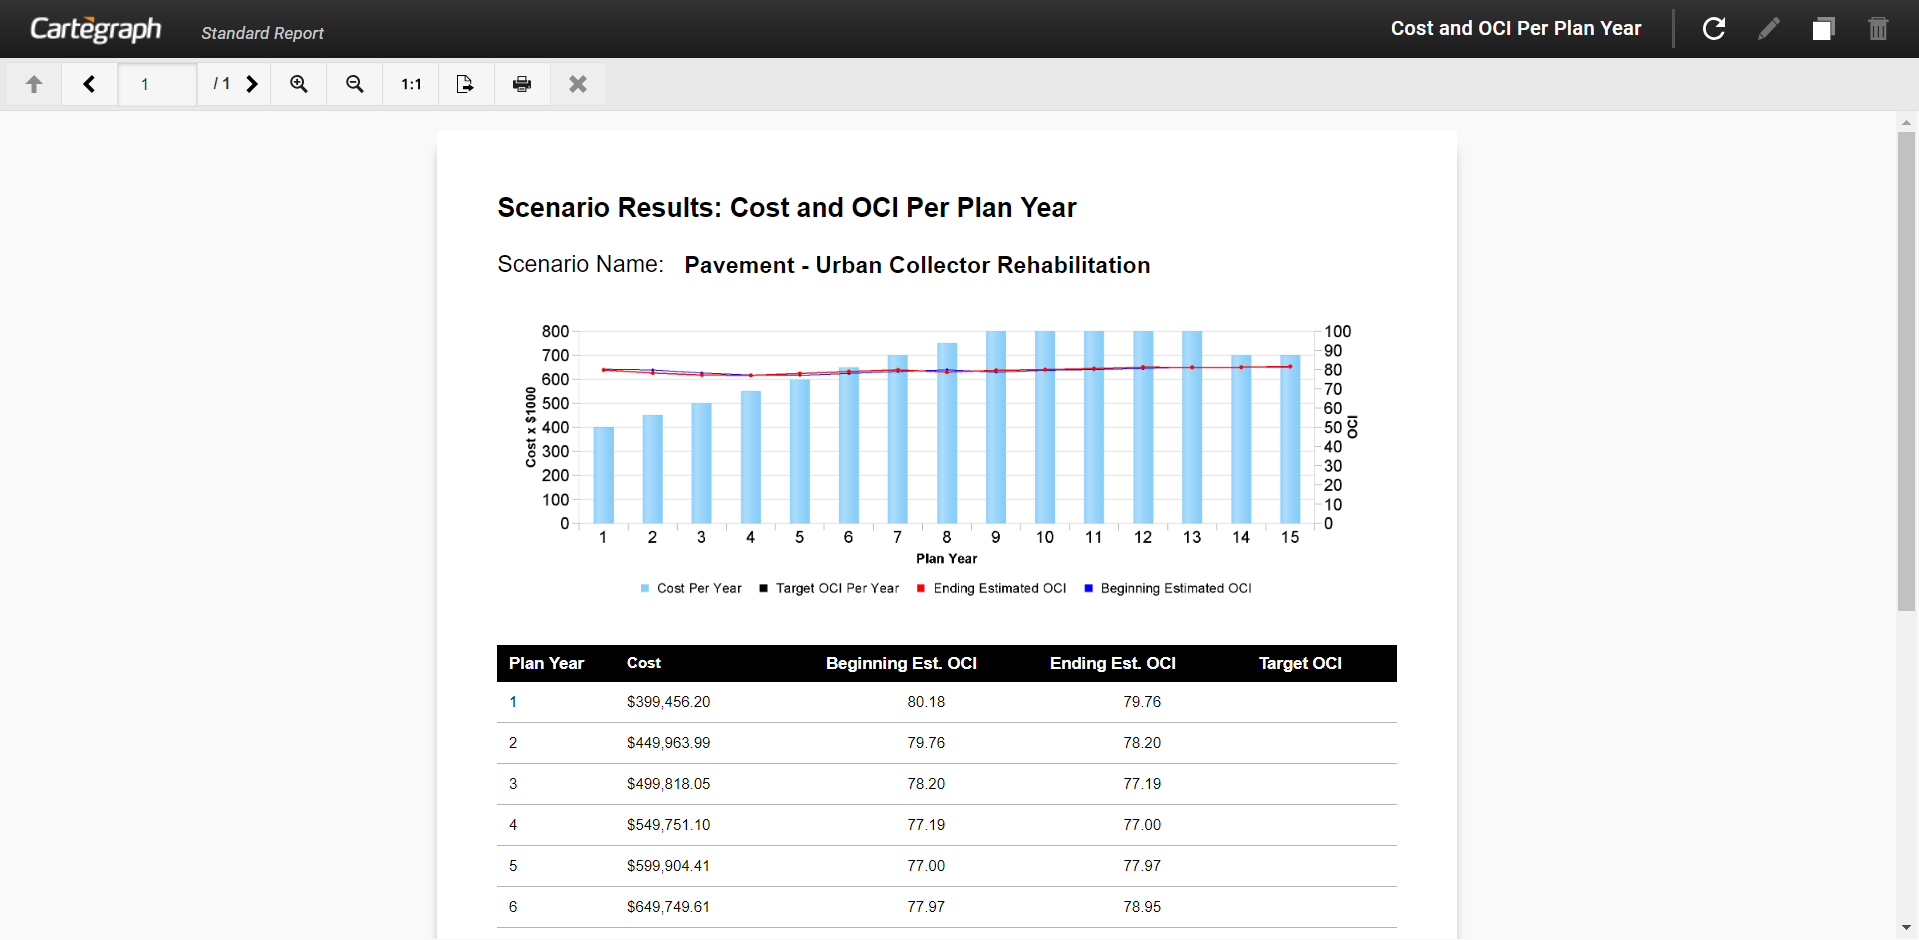
Scenario Builder/ Capital Planning
Scenario Results Tab
Scenario Map Results Tab
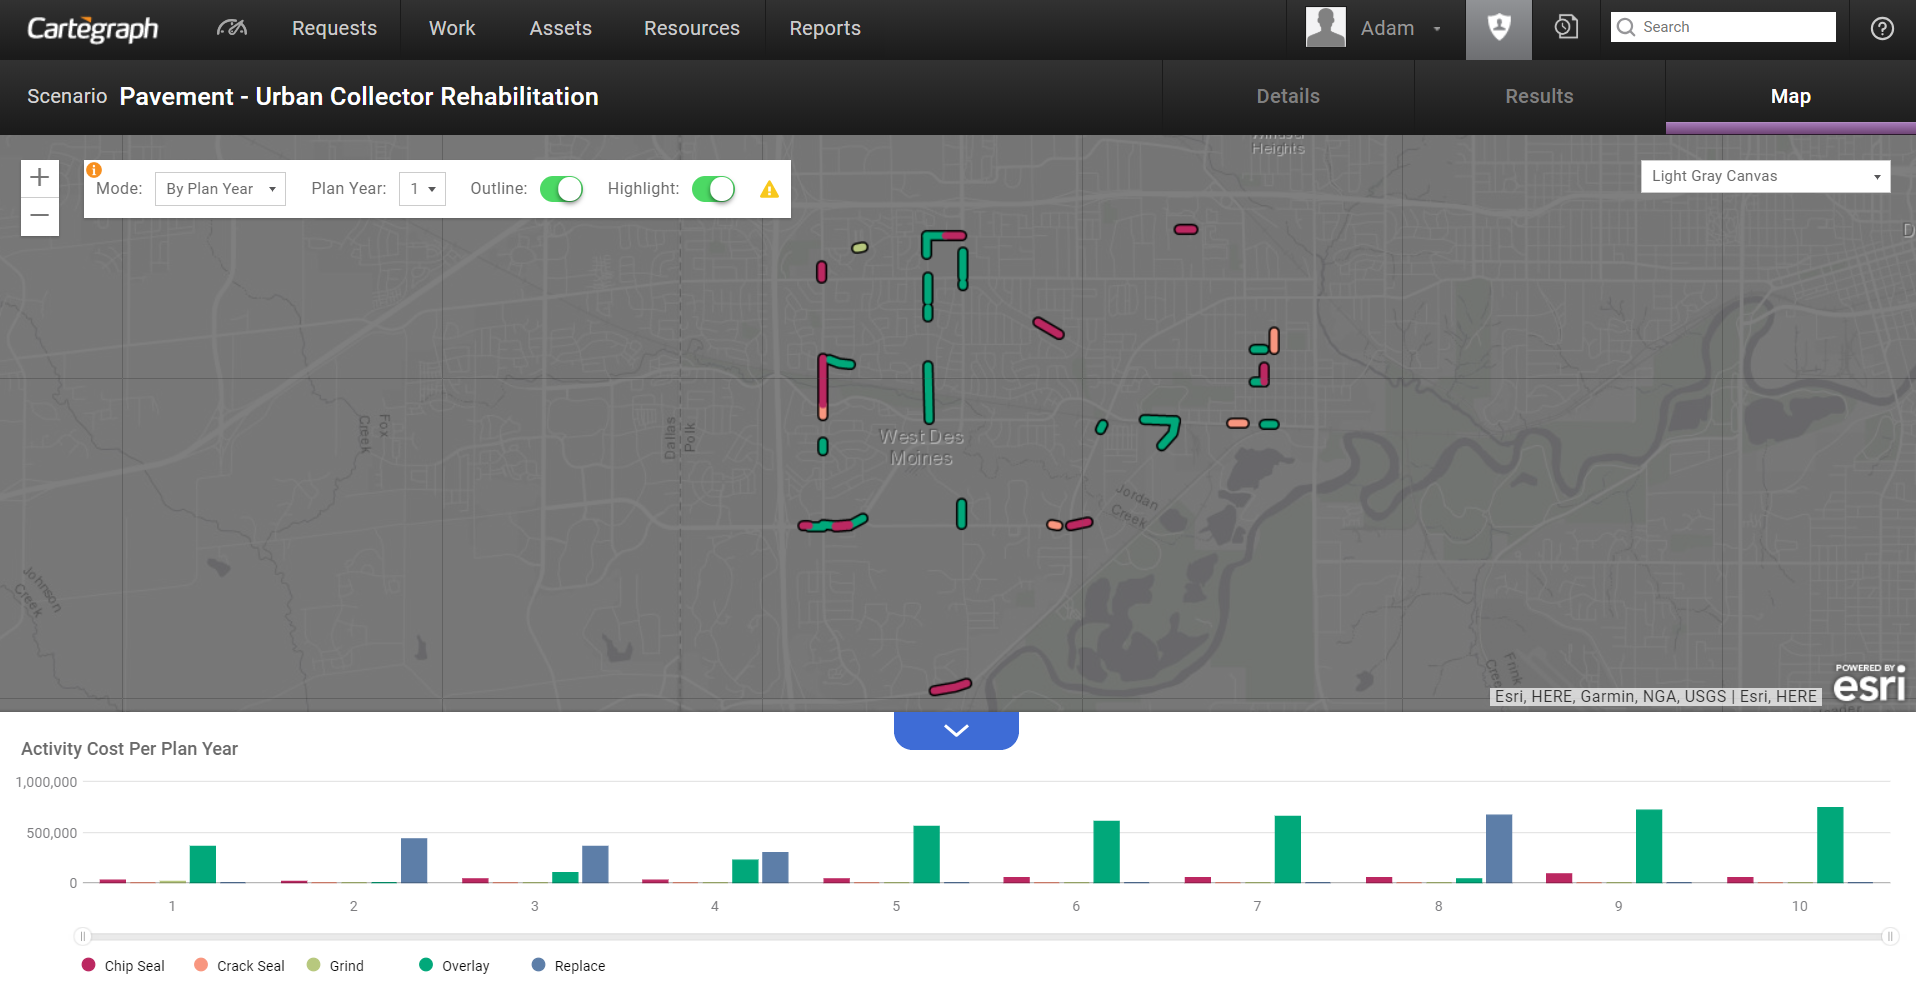
After a scenario runs view the results on a map by plan year or activity. This helps you review the results to refine the scenario until it is most effective for your organization.
Scenarios are used to identify projected activities with their cost and impact based on a defined work approach for any asset type. Access the Scenario Builder to setup, run, and adjust Scenarios to meet identified outcomes such as defined budget limitations or target network OCI (overall condition index).
Scenarios have five parts:
- Scenario: The scenario itself includes both scenario settings and cumulative results information.
- Budgets: Budgets are the mechanism to assign dollar amounts from a budget category. At the time the scenario is run, the category on the budget is used to find protocol triggers that have a matching budget category when assigning activities. Budgets are required to be set up for scenarios with a scenario type of Budget Limitation; even if entered, other scenario types do not use budgets when running a scenario.
- Plan Years: Scenarios can be projected out over multiple years called plan years. The start date and end date for each plan year are set based on the Scenario Start Date. Plan Years may include user input fields (based on scenario type) and include results information specific to each plan year.
- Activities: Activities are the most granular detail results of the scenario. The Activity List contains all assets and the recommended activities for the scenario. The activity will be blank for any assets where no activity is recommended for the plan year.
- Protocols: Protocols are the mechanism used to group specific assets in a given scenario for the purpose of recommending activities. Each protocol has a group of triggers that define what activities can be recommended and when each activity should occur. The Scenario Detail defines which protocols are associated with the Scenario. Protocols must be set up before running a scenario.
Key Scenario Settings
The following are key settings in the creation or setup of a Scenario. The options chosen for the following fields will have the greatest impact on the Scenario results.
These settings work together to determine your scenario results.
- Scenario Type: Determine what the scenario cut-off should be. Identify the end goal of your scenario; when that goal is met, the scenario will stop recommending additional activities.
- Sequence Type: Determine how to sequence or order your work. What work is a higher priority? What should be done first?
- Single Activity Recommendation: When more than one activity is recommended for a single asset in a single plan year, utilize this setting to decide which activity is applied to the scenario for that asset in that plan year.
Protocols and Triggers
You must have administrator rights to access this feature.
You must have a OpenGov EAM advanced feature extension to access this feature.
Protocols
Protocols are utilized by Scenario Builder. When creating a scenario, identify the protocols that apply to that scenario. For a given scenario, protocols are the mechanism used to group specific assets of the same type, for the purpose of recommending activities. Protocols use a filter to define the group of assets. Each asset on a scenario must qualify for one and only one protocol. Each protocol has a group of triggers that define what activities can be recommended and when each activity should occur. An activity may only appear once in a given protocol.
Triggers
Triggers are a component of Protocols, which are utilized by Scenario Builder. Each protocol contains one or more triggers. Triggers are the mechanism used to define which activities can be recommended for the group of assets defined in the parent protocol. Each trigger also states when each activity should occur, as well as the cost associated with doing the particular activity.
Run Scenarios
After creating a scenario and adjusting any other Scenario Details as desired, click Run Scenario. Immediately upon starting to run a scenario, the Run Status updates to Running and the Last Run Start time displays the current date and time. Existing scenario results, if any, are cleared at the beginning of the run. While a scenario is running, the running progress screen displays.
Users are able to leave the screen and work in other parts of the system while the scenario is running. If the user is viewing scenario running progress when the scenario completes, confirmation displays and the user can click Close on the screen and return to the Results tab. If the user is elsewhere in the system when the scenario completes, the screen automatically closes for them. The scenario run status updates to Completed, and scenario results are immediately available for review.
While a scenario is running, users are not allowed to edit or delete the scenario, its plan years, or protocol associations. While a scenario is running, the user is able to edit assets included in the scenario or edit protocols used by the scenario. At the beginning of the scenario run, the system gathers all necessary asset and protocol data. The Last Run Start field records the date and time a scenario run started. Any asset or protocol edits made after this time are not reflected in the scenario.
If the Scenario encounters a critical error while running, the scenario status updates to Stopped with Critical Errors. Any results that have been generated up to the point of the critical error are cleared to the extent possible. Last Run Start time is not cleared and continues to reflect the date and time in which the scenario last started. Access the Error Log to review a detailed error message and resolve any issues if needed. Run the scenario again to successfully complete the scenario.
While a scenario is running, any user who attempts to view the scenario sees the running progress screen. Any user is able to cancel a running scenario by clicking Cancel; all scenario results clear on cancel.
Budget Limitation Scenario Type
For Budget Limitation–type scenarios, warnings may display before the scenario is run, alerting the user to any budgets or protocol trigger records that may not be used while running the scenario. For example, a budget could be set up with a category of Major with none of the protocol trigger records for the scenario having this budget category set for them. In this case, the budget Major will not be used during the running of the scenario. The message would say:
The Major budget category does not have the corresponding triggers using this budget category. Make sure at least one trigger is set to Major.
In another example, there are protocol trigger records that have a budget category of Medium and Low, with no budget set for the scenario using these budget categories. In this case, the trigger records with these budget categories will not be used during the running of the scenario. The message would say:
You have triggers with Budget categories without a corresponding budget. Add a budget to the scenario for the Medium, Low budget categories.
If you don’t add a budget, the associated activities cannot be recommended.
Asset Analytics Report (Example)
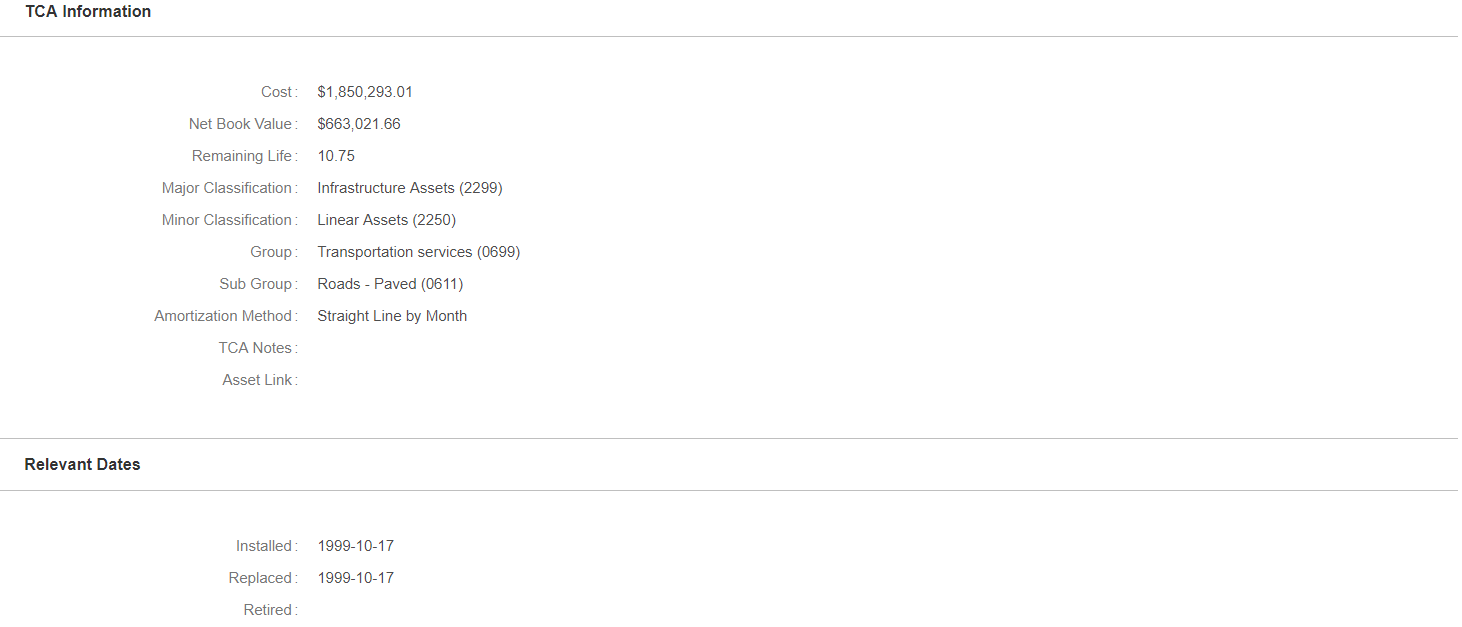
Tangible Capital Assets (TCA)
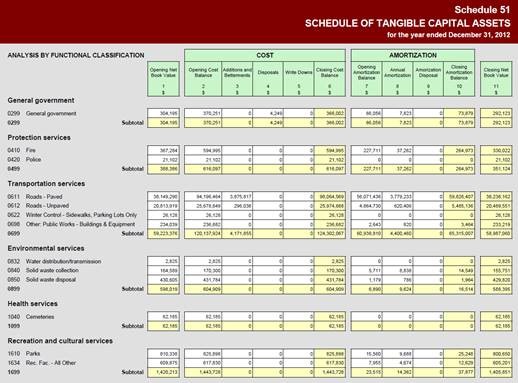
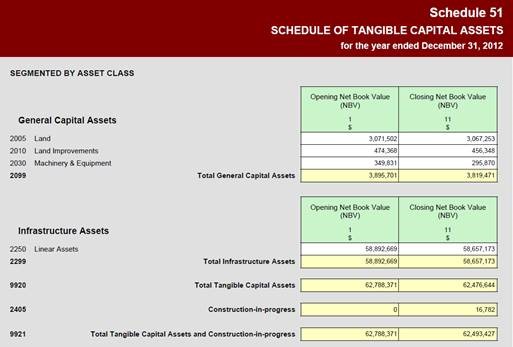
Let the power of the OMS TCA Extension bring everything together for PS-3150 compliance; including a full slate of reporting to generate TCA Schedules. Use the built-in tools to automatically deflate assets and treatments based on replacement values, actual values or general unit costs. The module handles all financial transaction types including: Historical Costs, Betterments, Write ups, Write downs, Partial deletions, Full deletions and Work in progress. Automatically roll up maintenance costs as capital activities when user-specified thresholds are met. Break up and categorize assets and activities however you want through the fully customizable rules set or just use the defaults directly out of the box. Out of the box the system supports Amortization: by month, by half years, by year, double declining balance and non-depreciating. The system fully supports integrating additional amortization methods as well through the in-built configuration tools. Simply import your previous year’s results and let the system take it from there.
TCA Information (Example)
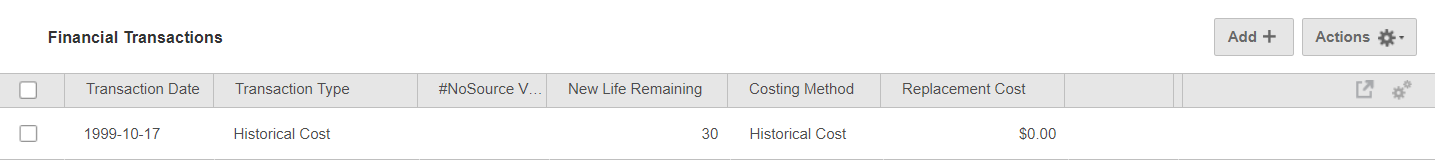
TCA Financial Transactions (Example)
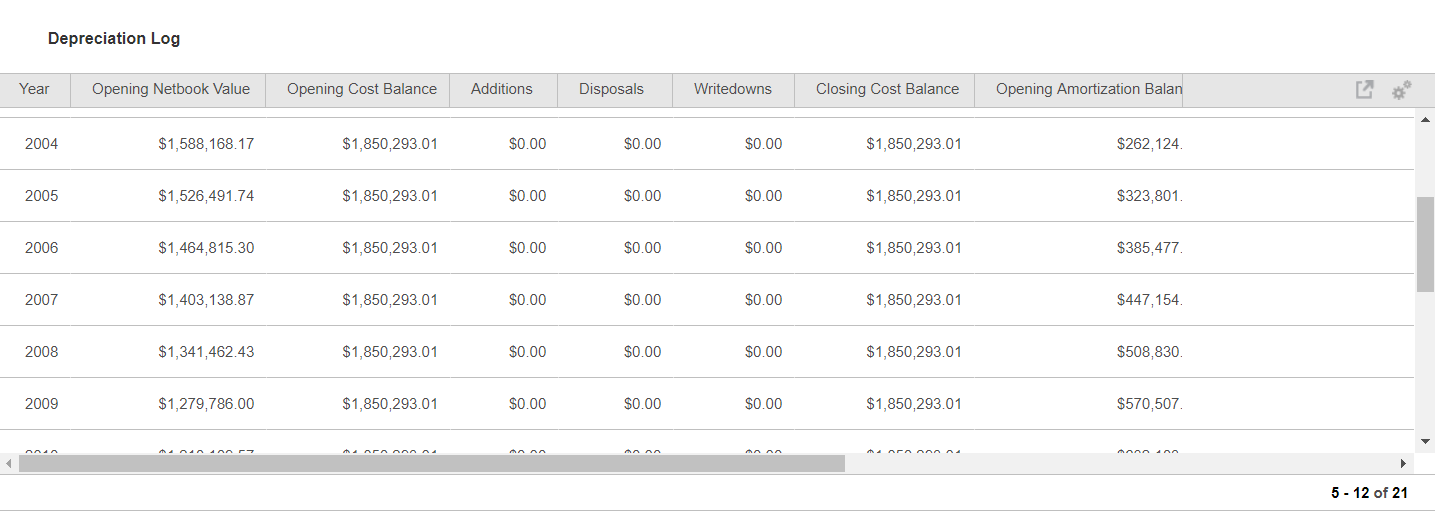
TCA Depreciation Log (Example)
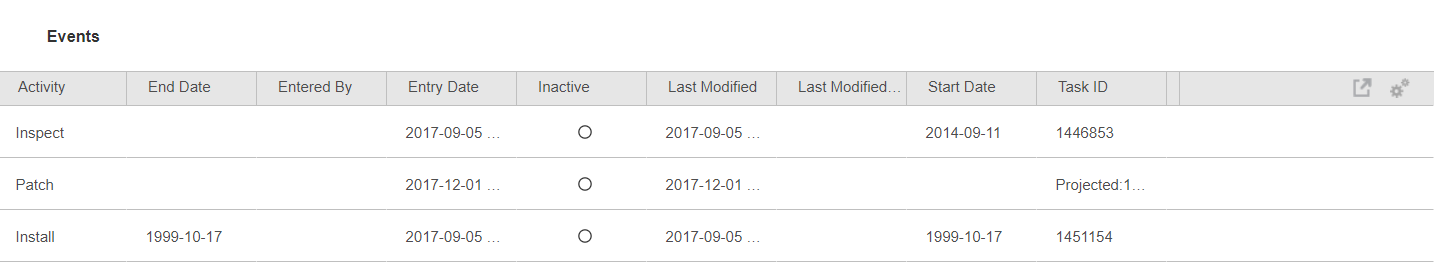
TCA Events (Example)
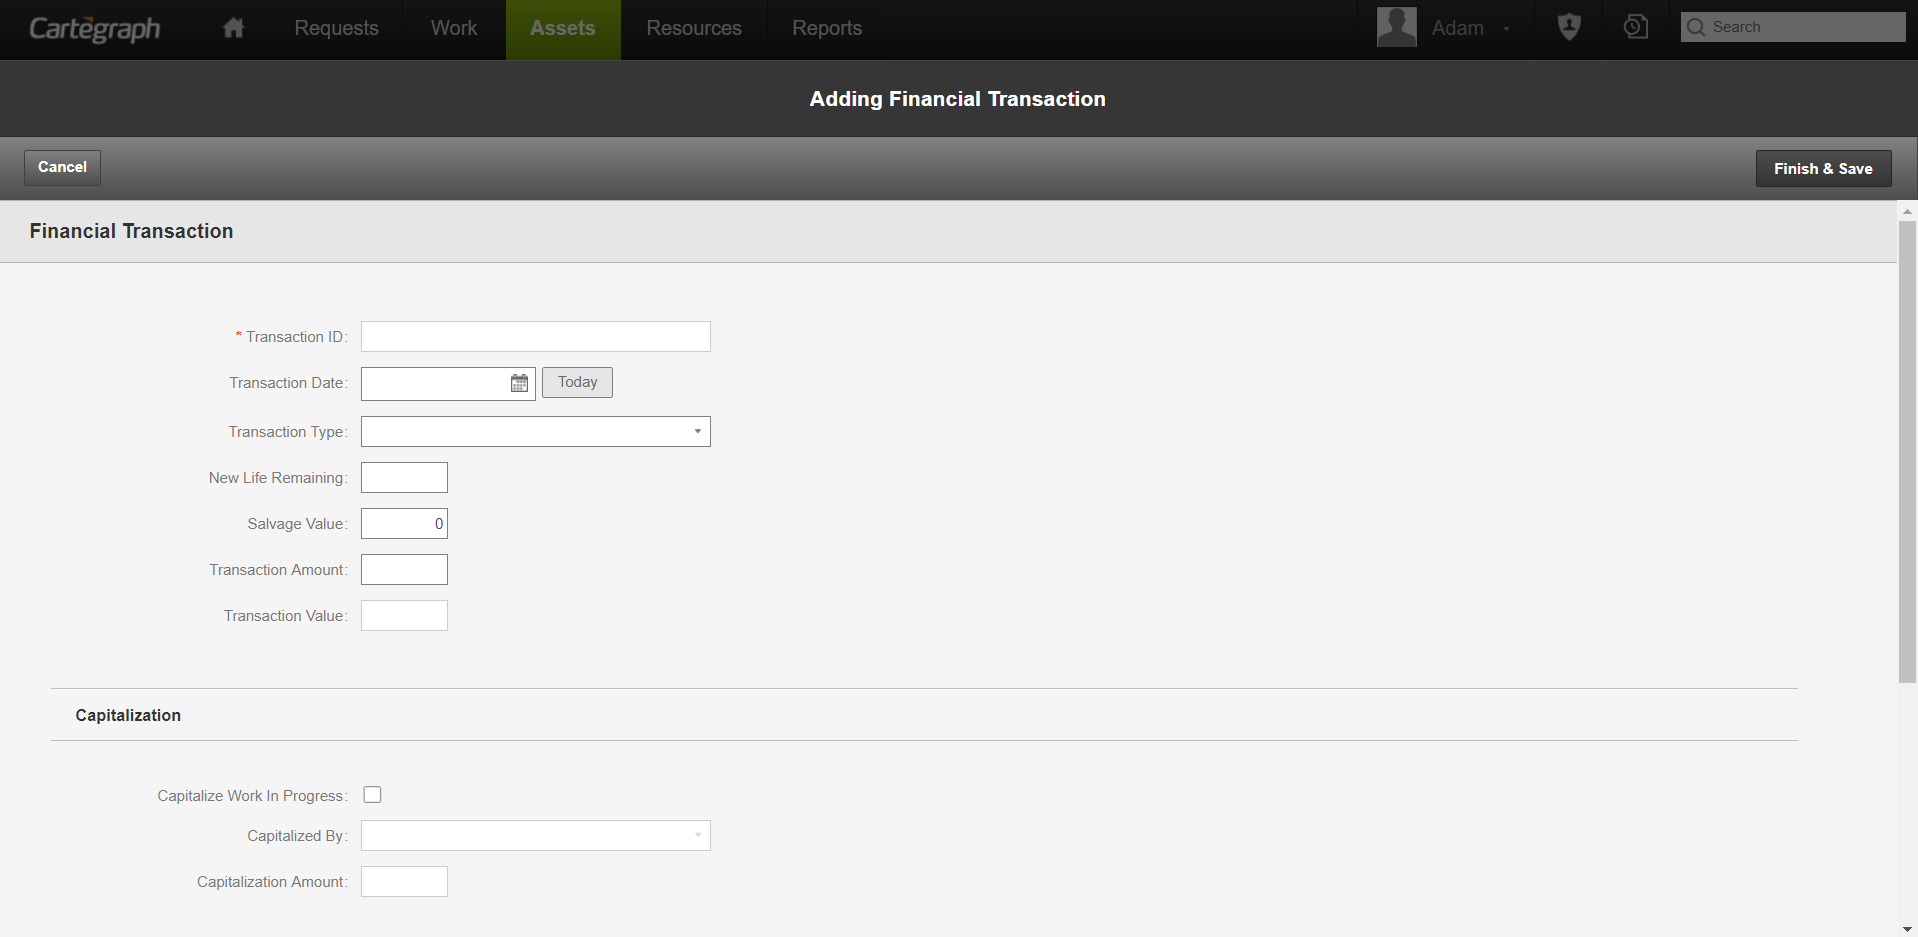
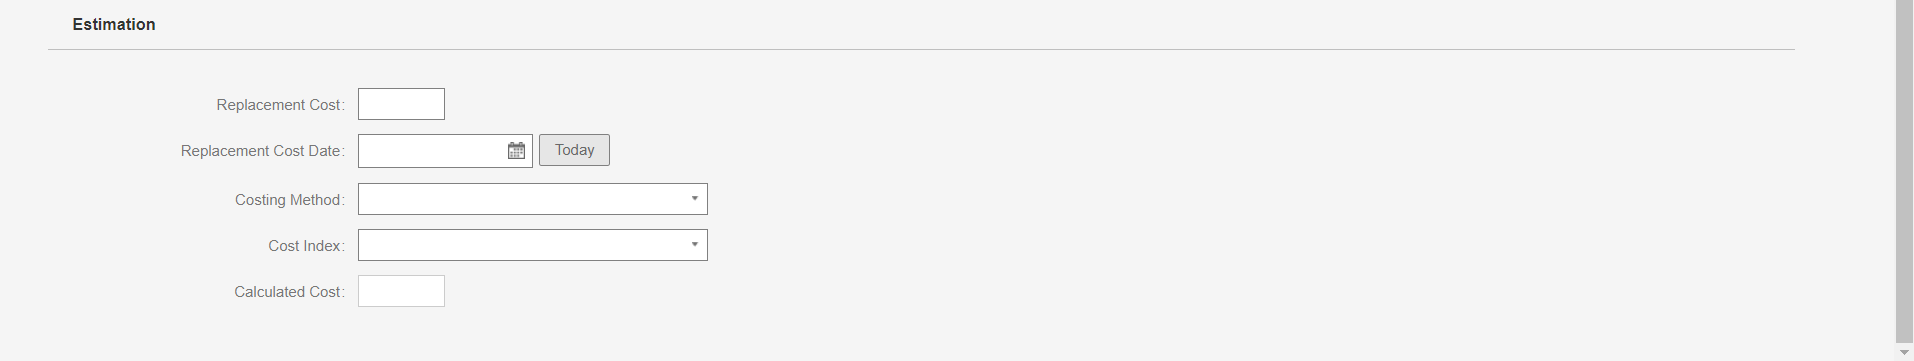
TCA Adding TCA Financial Transactions (Example)
TCA Reports (Example)
User Interface
- Analytics Dashboard
- Navigation Persistence
- Global Search
- Table of Contents/ Layers
- Map Tools
- Documents Attachments
- List View Data Export
- More Information…
Request Management
Work Management
- Work Orders
- Repeating Work Orders
- Tasks
- Activities
- Task Calendar
- Time Sheets
- Distribute Resources
- Task Triggers
- Preventative Maintenance
- More Information…
Asset Management & Analytics
Resource & Inventory Management
Report Management
Mobile Management
Workflow Management
System Management
- Structure Manager
- Library Manager
- Layout Manager
- Esri and Active Directory
- Security Role Administration
- System Licensing
- System Requirements
- More Information…