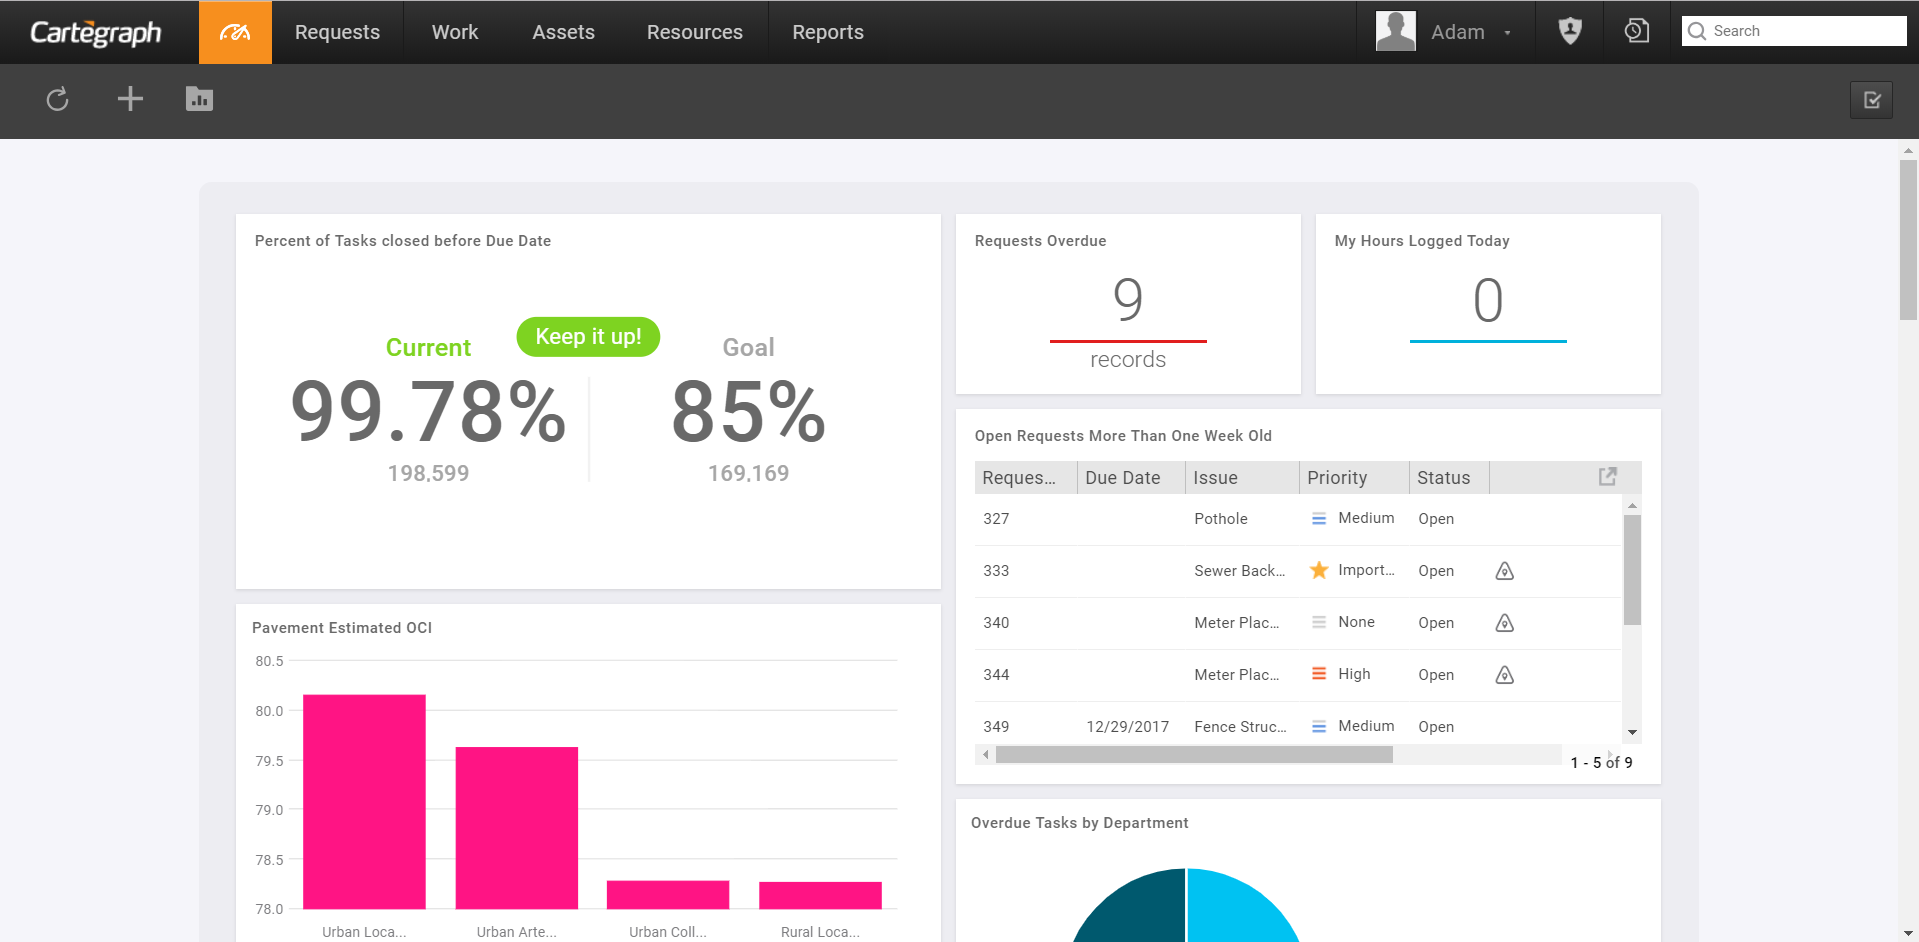
Cartegraph’s Analytics Dashboard takes the good data you capture and allows you to analyze that data and use it to guide your decisions by getting quick access to the data you care about—and make smarter decisions throughout your workday.
Rearrange, add, resize, and remove gadgets from the dashboard at any time. These changes immediately persist. Each time you sign into Cartegraph, the dashboard displays the same gadgets in the same layout.
When you need to view the data in more detail, select any grouping, like a bar, column, or slice, on the chart. A dialog box opens with a detailed list of the data in that group. This is where you change the grouping you want to view. The layout of this list is the same as the List view. Also available is a List gadget, which can be used to quickly show records on your dashboard without going to a list view.
Each gadget has an action menu that allows you to:
- Edit the gadget data.
- Duplicate the gadget data to customize a Library gadget.
- Export as a PDF, PNG, or CSV to share and analyze the data as a document, image, or spreadsheet. List gadgets are CSV export only.
- Resize the gadget with the Size menu option. Only the applicable sizes are shown in the menu. This menu option only displays if the size can be changed.
- Delete to permanently remove the gadget from your dashboard.
The maximum number of gadgets allowed in the dashboard is 20. The maximum number of bars in a column/bar chart is 20. Data is truncated but still visible in the Drill Down dialog box by clicking on a bar in the chart. If multiple Group By fields are selected, the maximum number of bars is 64 (or 108 if you are doing a time series grouping). Data will be arranged so each cluster of bars has the same exact subset of categories. For example, if you are grouping by a Date Field and a Lookup, the Lookup values will be truncated to accommodate for 64 bars.
Each gadget is made of:
- gadget types
- a title
- a recordset
- a filter
- a list of roles and users to share with Gadgets created by you are automatically available in your Gadget Library. The selected roles and users will also have access to this gadget in their Gadget Library.
Bar, column, and pie gadgets also have Group by fields. This is limited to Lookup, Text, Yes/No, Date, Date/Time, and Time field types.
If the recordset chosen is a child level recordset, then the group by options will also include the parent level recordset fields.
For Date, Date/Time, and Time fields, you will also need to choose how the grouping should be performed:
- Hour of day
- Day of week
- Week of year
- Month
- Quarter
- Year
- Month and year
- Quarter and year
- A second Group By field
- Available for bar and column charts.
- List is limited to Lookup, Text, and Yes/No fields. Date fields are not available in the second Group By.
- Using this will create clusters of bar/columns to help visualize your data.
- Measured-by parameter
- Total Count is the default.
- If you select a different field, the Sum or Average option of the selected field overall records in each group displays.
- This list is limited to Integer, Floating Point, Currency, and Quantity field types.
- For Quantity fields, you also need to select the Unit to Convert all of the data before summing or averaging.
Preview
A Gadget Preview is available when you create or edit gadgets to see a preview of the gadget before it is saved to the dashboard and/or gadget library.
A preview is only available when the minimum required of fields are selected in the create process. Once a preview can be generated, a Preview button displays. Click Preview to see what the gadget will look like in the dashboard. If any of the setup fields are changed, the Preview button displays again to see the updated version of the gadget. List gadgets automatically generate a preview once a recordset is selected.
The gadget previewer is available when creating editing, or duplicating a gadget.
You can have additional gadgets stored in the Gadget Library. The library includes those on your dashboard and those shared by other users.
Legends
Gadget legends show the data point attached to each color and serve as an interactive way to filter the data displayed. Select and clear the legend values to show only the selected values in the legend. The legend works this way for bar, column, and pie charts.
The legend displays on bar and column charts if more than one group by field is selected and if the charts are grouped by a single date field with month over year or quarter over year.
Multiple Groupings
Use more than one grouping to create a Clustered Bar or Clustered Column chart gadget. These clustered bars of data work as two charts in one. Here are some key things to know about multiple groupings:
- They are not available for List gadgets.
- The number of bars per group is limited to 8, and the total number of bars allowed is 64. If you are doing a time series grouping (month and year or quarter and year), then the total number allowed is 108.
- The first Group By field can be any field except:
- Attachment
- Number
- Currency
- The second Group By field cannot be a Date, Date/Time, or Time field. Dates are only available in the first Group By field.
- Advanced Filters should be used whenever possible to make sure the data is legible and informative. Too many records can clutter up your chart and provide no additional value.
- When grouping by a Date, Date/Time, or Time field, select to group by Quarter and Year as well as Month and Year. Grouping in one of these ways also shows a Clustered Bar or Clustered Column chart. Each bar or column represents the data for a single quarter or month in a given year.
Gadget Drill Down
When you need to view the data in more detail, select any grouping, like a bar, column, or slice, on the chart, and a dialog box opens with a detailed list of the data in that group. The list shows all of the records that belong to that particular group. You can change the selected grouping using the fields near the top of the dialog. There is a field for each group by field. This allows you to navigate through the data without closing the dialog box and selecting a different bar, column, or slice on the chart. The upper right-hand corner of the dialog box shows the aggregate value for the group(s) selected. Each field has an All option that is always the first item in the field. This shows all records from that particular grouping.
The list columns and arrangement are based on your persisted list view settings, depending on the recordset you are viewing. Any changes made in the drill down view or list view display here.
Refresh Gadget
There are two methods to refresh your gadget:
- Refresh your full page by refreshing your browser.
- Refresh all gadgets by clicking.
User Interface
- Analytics Dashboard
- Navigation Persistence
- Global Search
- Table of Contents/ Layers
- Map Tools
- Documents Attachments
- List View Data Export
- More Information…
Request Management
Work Management
- Work Orders
- Repeating Work Orders
- Tasks
- Activities
- Task Calendar
- Time Sheets
- Distribute Resources
- Task Triggers
- Preventative Maintenance
- More Information…
Asset Management & Analytics
Resource & Inventory Management
Report Management
Mobile Management
- Cartegraph for iPad and Cartegraph One Feature Comparison
- Cartegraph for iPad
- Cartegraph One
- More Information…
Workflow Management
System Management
- Structure Manager
- Library Manager
- Layout Manager
- Esri and Active Directory
- Security Role Administration
- System Licensing
- System Requirements
- More Information…